Testing the Waters
The first experiment in an agentic investment system, and why the core had to be built before the brain
A tool that watches, before a tool that thinks
I did not start this to get rich in a month. I started it because of a finance class. In the EMBA finance subject, Professor Nadia Masood showed how much of investing is watching: knowing what you hold, what it cost, what it is worth today and how much risk it carries. She made me want to build a tool with AI that does the watching for me. Around the same time, Sebastian Teegen Andreson got me thinking about agentics in finance, about the flow of how deals are found, argued over and moved along, and what it would look like if agents did that work. And the cohort itself was the third push. A room of senior, capable people had a real hunger for finance, and a very wide spread in how literate they were in it. I was somewhere in the middle.
So I sketched the grand version first: an agentic system that scouts, shortlists, decides, buys, watches and sells. Then I looked at it honestly. Every box on that sketch was a question I could not answer. How do you scout? Why reject something, and can it come back? How do you know when to sell? None of those has a fixed answer. Each one needs an experiment, and an experiment needs a result.
This paper is the first experiment. One folder, one AI, $200 of my own money a week, and a ledger that would not let me lie to myself. It is the smallest version of the big idea that could still tell me something true. I lost $29.13 doing it. It was the best money I spent all month.
Written from the experiment’s own records, September and October 2026.
Abstract
An agentic investment system has to answer a chain of questions: where ideas come from, what makes a shortlist, which theory applies, when to buy, how to watch, when to sell, and what to learn from every rejection. None of these has a deterministic answer, so none can be designed on paper. This paper is the first of six. It describes the first experiment: the core of the system, built and run for one month with real money before any of the harder questions were tackled. An AI agent, running as three scheduled tasks on a Mac, kept a research table, a buy table, a sell table and an append-only ledger for a Sharesies portfolio funded at $200 a week. I typed every order and pressed Buy myself. Over 30 days the agent wrote 15 reports and 40 research files, and took its own data model through six versions in its first ten days while its test suite grew from 71 to 264 tests. It made seven calls. I acted on three of the five that could be scored and skipped two, and on one of the three I put in more than two and a half times the money it asked for, into a different stock. A$1,232.75 went in, and at the 26 October close the portfolio was worth A$1,203.62 with cash, a loss of A$29.13 and about A$8 behind the same dollars put into a global index fund on the same days. The ledger had first reported the opposite, $30.99 ahead, because it counted purchases rather than deposits. The experiment answered the questions it was built for: the AI can watch a portfolio, record the truth and hold me to my own calls. It could not say whether any of its ideas were good, because one call a week, rules that kept moving and a single benchmark give activity, not results. That gap sets the gate for the next paper.
Keywords: agentic AI, investing, experimentation, stage gates, human in the loop, portfolio monitoring, dollar-cost averaging, ledger, benchmark
Part I: The grand design and its unknowns
Don’t tell me what you think, tell me what you have in your portfolio.
Nassim Nicholas Taleb, Skin in the Game, 2018
1. Thirty days in one folder
On Sunday 27 September 2026 an AI agent made its first call on my money. It said to put $200 into VGS, Vanguard’s index fund of more than a thousand large companies outside Australia, and it put Berkshire Hathaway and Allstate on its first conviction list. Two days later I bought $200.00 of VGS in Sharesies. The ledger recorded it to the cent.1
Thirty days later the folder held a database, a dashboard, a workbook, 15 reports, 40 research files and about 4,500 lines of Python that the agent had written, tested and rewritten as it went. On 27 October I froze it, copied it into a new home, and started again with a different design. This paper is about those thirty days.
It is the first paper in a series of six called Skin in the Loop. The name holds the two rules I set at the start. Skin in the game: real money, every week, so the results mean something. And a human in the loop: the AI researches, records and recommends, but I type the amount and press Buy. The series follows one idea from a folder to a full agentic system, one stage at a time, and each stage has a gate it must pass on results before the next one starts. This first paper is about testing the waters.
2. The design I wanted
The grand design is easy to say. A system that finds investment ideas on its own, argues them through, picks the strongest, buys with discipline, watches every position, sells on rules rather than feelings, and learns from every win, loss and rejection. It runs every day. I check it, and the important doors stay locked unless I open them.
I am not going to describe the end state in more detail here. It changes every time an experiment comes back, and that is the point of this paper. The sketch was useful for one thing only. It showed me how much I did not know.
3. Eleven unknowns
Walk an idea through the design and it meets a question at every step (Figure 1).
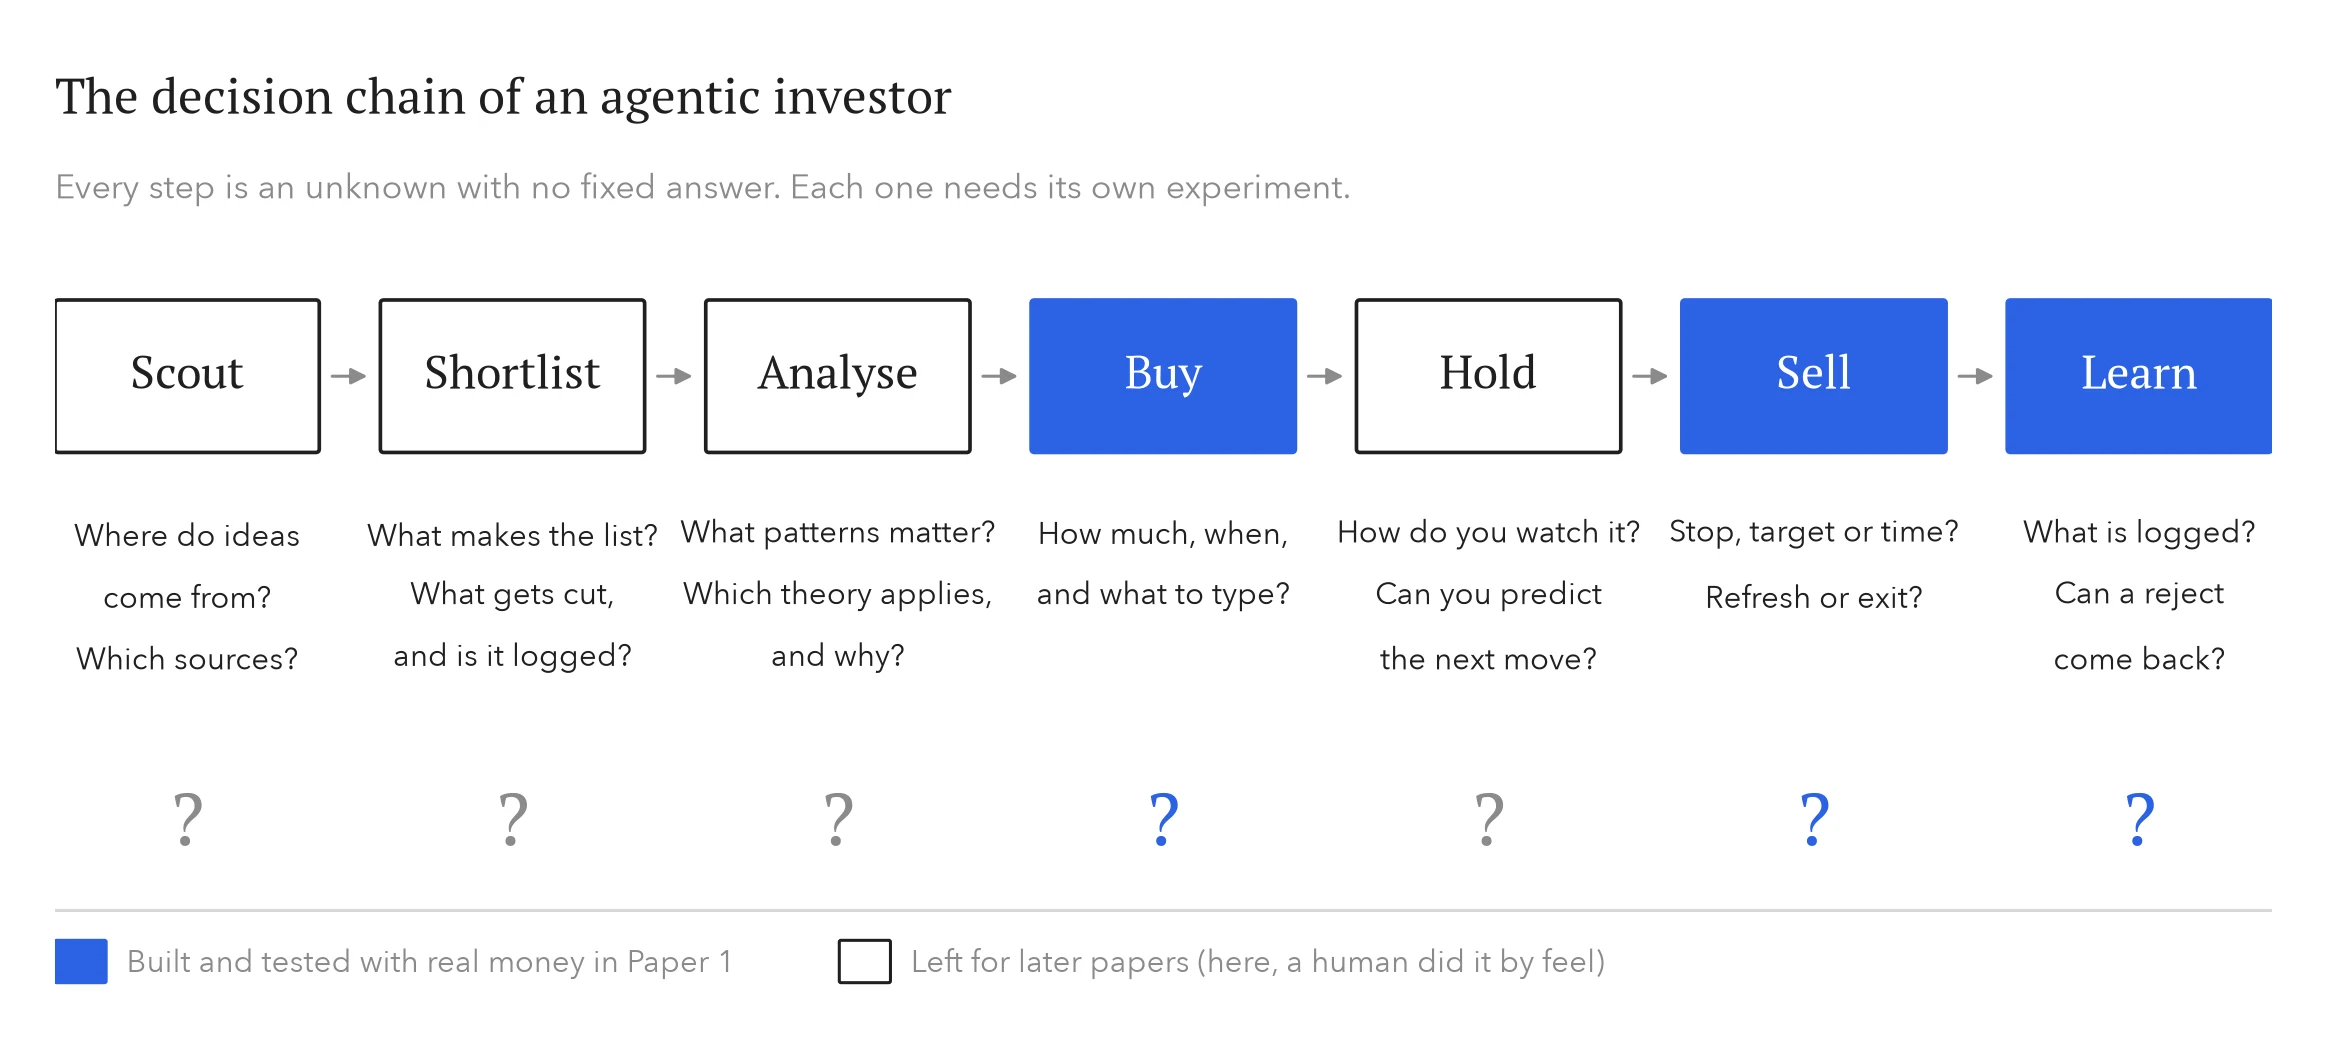
Figure 1. The decision chain of an agentic investor. Every step is an unknown. Blue steps were built and tested with real money in this first experiment. White steps were left to me, and I did them by feel.
- Scout. Where do ideas come from? Screens, news, filings, analysts, other people?
- Shortlist. What makes the list, and how long can a name stay on it?
- Look for. Once a name is on the list, what do you look for in it?
- Patterns. Does what you look for have patterns that repeat?
- Theory. Which investing theory applies to this name, and why that one?
- Reject. Why do you say no?
- Log. What do you write down when you say no?
- Revive. Can a rejected idea come back, and what brings it back?
- Predict. Can you say anything useful about what happens next?
- Monitor. How do you watch a position without staring at it?
- Refresh. When do you top up, trim or exit?
Every one of these has the same property. Reasonable people answer it differently, and the answer that works depends on the market, the money and the person. There is no formula to look up.
4. Why you cannot design your way to an answer
Most systems I build at work are deterministic. If the requirement is clear, a good design gets you most of the way. An investment system is not like that. Two sensible rules for when to sell can both be defensible and still produce opposite results over the same month. The only way to find out which one works is to run it and score it.
That changes how the system has to be built. Product teams learnt this a long time ago: build the smallest thing that can be measured, measure it, and learn before building more (Ries, 2011). New product development learnt it too, with stage gates, where a project only earns its next round of investment by passing a review of real evidence (Cooper, 1990). I borrowed both. Instead of building the whole design and hoping, I build each part as its own experiment, on its own, and connect them only after each has shown a result.
Two definitions keep this honest.
Definition 1 · Experiment. An experiment is a rule run on real or paper money for long enough to score it. It has three parts: a rule written precisely enough that a machine could follow it, a record of every decision the rule made, and a comparison against something simpler that could have been done instead.
Definition 2 · Result. A result is the difference between what a rule did and what the simpler alternative would have done, with the same money on the same days, after fees and tax. Anything else is activity.
The simpler alternative in this series is VGS, the global index fund. If an idea cannot beat buying VGS with the same dollars on the same days, it has not earned a place.
The first experiment did not try to answer the hard questions in Figure 1. It tried to build the floor they would stand on: somewhere to record research, a buy table, a sell table, and a ledger that tells the truth. Without those, no later experiment can produce a result at all.
Part II: The first experiment: building the core
5. Why $200 of real money, every week
The first rule was the most important. The money is real, it is small, and it arrives every week.
- Paper money lies. It has no fees, no currency spread, no orders that fail to fill and no flinch when a stop is hit. Every one of those showed up in the first month, and none of them would have shown up on paper. Each US purchase lost about 0.6% to currency conversion. One order did not fill. Micron hit its stop and cost me real dollars.
- Small enough to lose, big enough to feel. $200 will not change my life if an idea fails. But it is enough that I read the result instead of shrugging at it.
- Every week is a data point. A lump sum is one experiment. Fifty-two weekly buys are fifty-two decisions a year, each logged, scored and compared with what the system said to do.
- It forces a decision. The system has to produce one answer by Sunday evening. That deadline is what turned a chat with an AI into a system. It had to build research, a buy table, a sell table and a ledger, because it had to have an answer ready every week.
- It takes timing out of the question. Putting the same amount in every week, called dollar-cost averaging, means the experiment tests what to buy, not when.
- The human stays in the loop. I type the amount and press Buy. The AI never places an order. That is the first gate of trust, and I hold it on purpose.
What it builds is more valuable than the returns at this size: a habit, an honest ledger, and a growing set of decisions with their outcomes attached. Every later system in this series gets tested against that record.
6. The setup
The whole experiment lived in one ordinary folder on my Mac. Inside it were a SQLite database (the ledger), a set of Python scripts, a dashboard page, an Excel workbook, and folders for research and reports. An AI agent did the work through three scheduled tasks, each allowed to touch that folder and nothing else on the Mac (Figure 2).
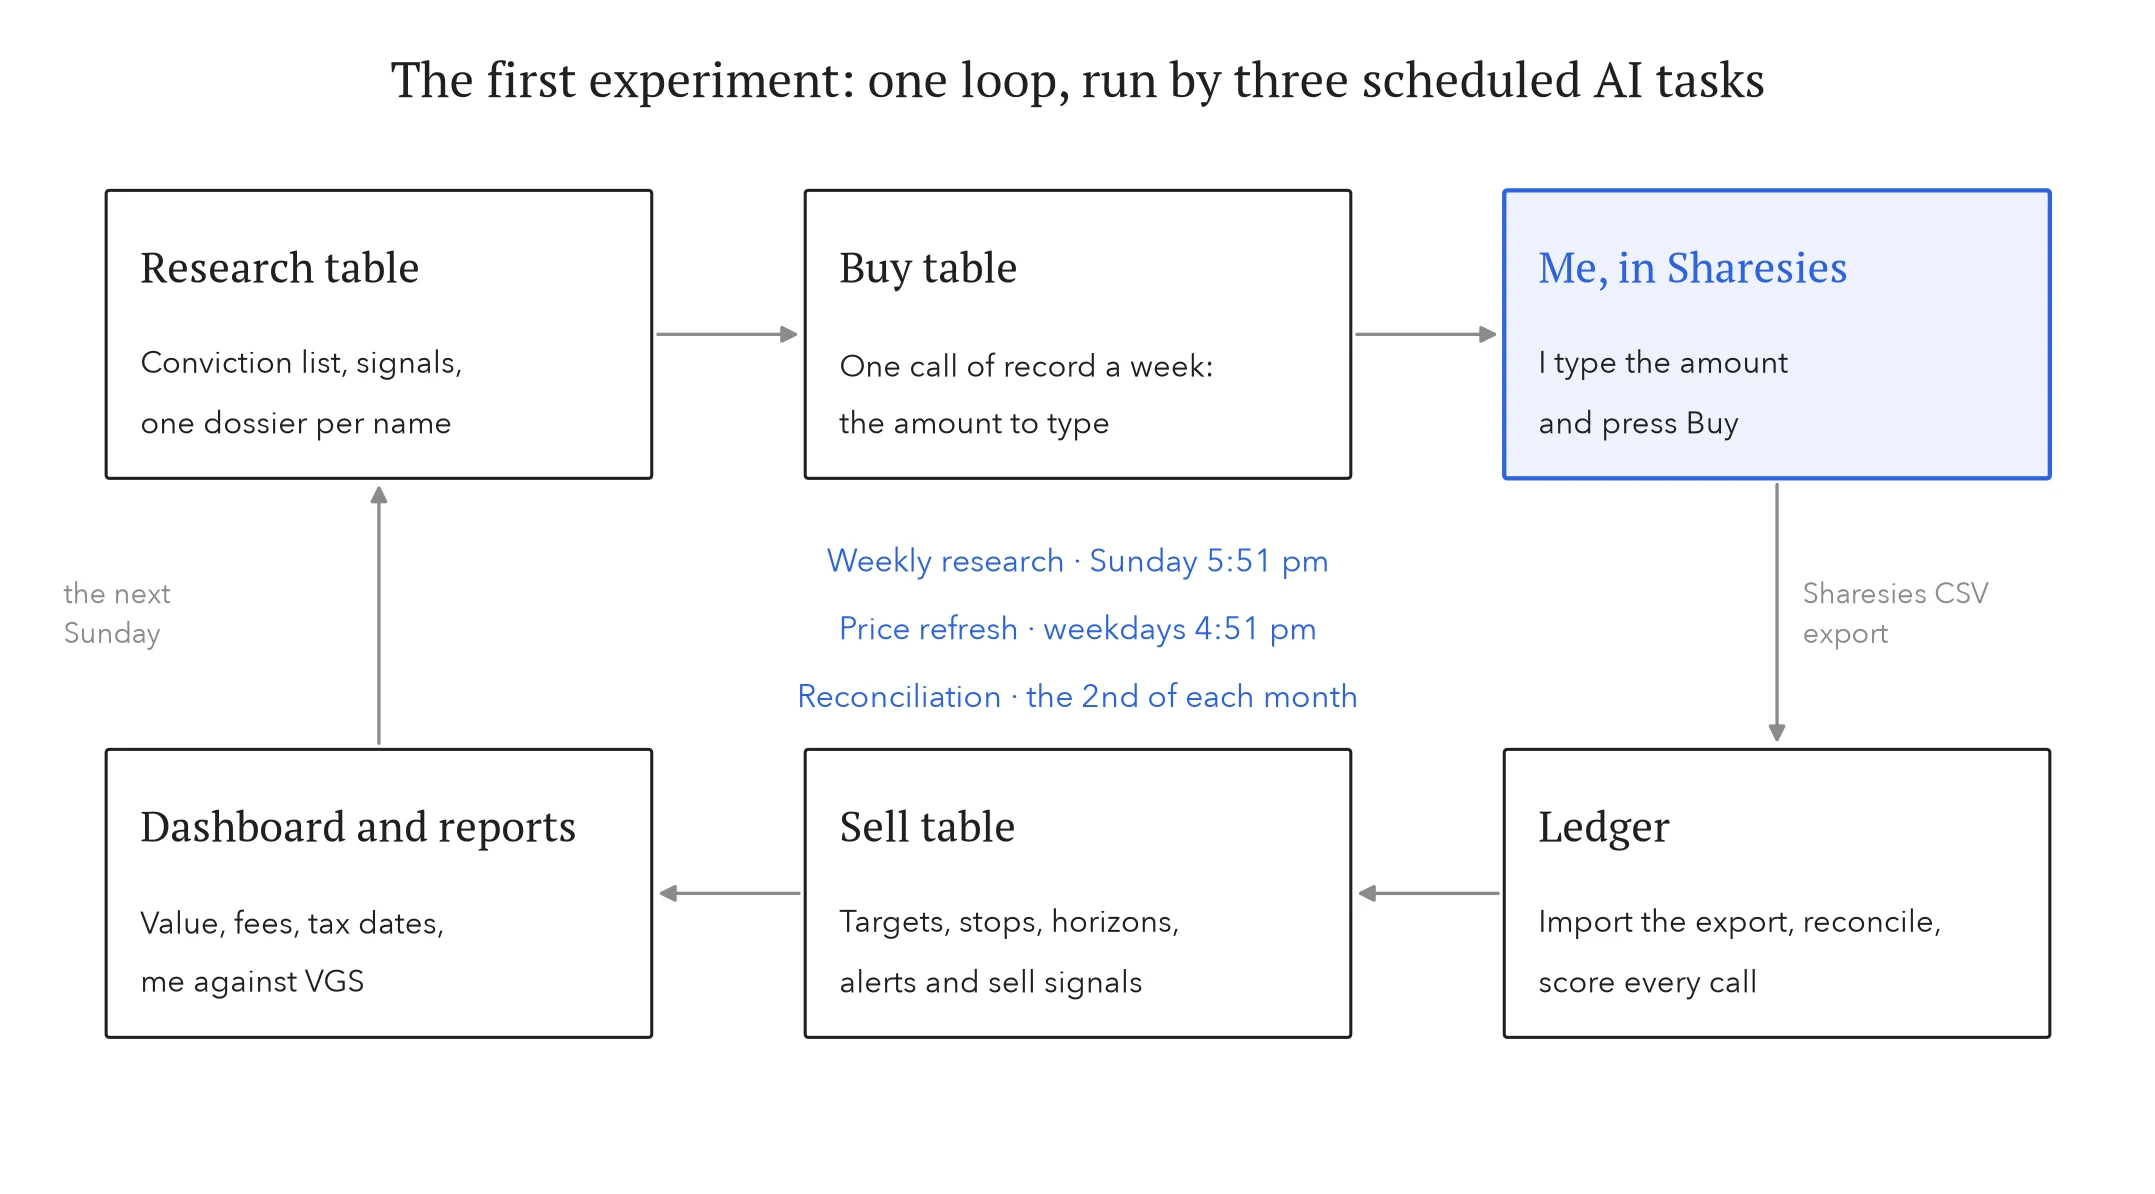
Figure 2. The core loop of the first experiment. Research feeds a buy table. I place the order. The Sharesies export flows into the ledger, which scores every call and drives the sell table and the reports. Three scheduled AI tasks keep it turning.
- Weekly research, Sundays at 5:51 pm. Update the research, decide the week’s call, write the report and email it.
- Price refresh, weekdays at 4:51 pm, after the ASX closes. Fetch prices for what I hold, check the alerts, rebuild the dashboard.
- Reconciliation, the 2nd of each month. Import the Sharesies export, match every trade to the call that asked for it, score the month.
The odd minutes were deliberate. Scheduled jobs that all fire on the hour pile into each other, and a run at 5:51 pm has the week’s closing prices without colliding with anything else.
I did not write the code. I described what I wanted, read what came back, and corrected it. Everything in the folder was written by the agent, including its own tests.
7. The research table
The research side kept a conviction list: every name the agent thought worth owning, with the date it joined, the reason, and a weekly signal beside it. Each name had a dossier, a running file with a dated entry for each week it was looked at. Earlier entries were never edited, so I could read how a thesis changed and check the reasoning against what happened next. Names that were screened out kept a file too, so if one came back the earlier thinking was still there.
On 29 September the research split into two sides.
- Core. Long-term names held by default, such as VGS, ResMed and Berkshire Hathaway.
- Bold. Momentum and deep-value names, each bought with a target, a stop and a time horizon, and reviewed every week. New money stopped going to the bold side once it passed a third of the portfolio.
On 7 October I asked for something more. Every week, alongside the main call, the agent offered two climbers: names up at least 30% over three months and trading above their 50-day and 200-day average prices, with the earnings or estimates behind the move. They came with no amount, so the decision was mine.
By 27 October the list had fifteen names, seven of them climbers.
8. The buy table
Every weekly report opened the same way: what to buy this week. One line, the amount to type into Sharesies, and roughly how many units it would get. A US share is bought in US dollars, so its line gave the US dollar figure to type first, in bold, with what it would cost in Australian dollars beside it. That last detail came from a mistake, described in Section 12.
The buy table held one call of record a week. The ledger enforced this. On 28 September I started the weekly task by hand, not realising the scheduled run had fired fifteen minutes earlier. The second run found the week already decided, added nothing, overwrote nothing, and said so. That one refusal is the reason the follow rate in Part III can be trusted. If a system lets you change the call after the fact, you can never score it.
The shape of the call changed twice in ten days: from one name to the $200 split across two names, then back to one safe pick with two climbers offered beside it. Each change was a small experiment of its own, and Section 14 shows what that did to the data.
9. The sell table
Every bold purchase came with an exit written before the money went in: a target, a stop and a horizon. Micron, bought on 5 October, had a target of US$1,400, a stop at US$900 and a horizon of three to nine months.
The daily refresh checked every holding against its exit and raised an alert when one of these was hit:
- up 20% or more on what I paid
- down 15% or more
- 15% off its highest close since I bought it
- up or down 10% in a week, or 7% in a day
- at or near its target or stop.
When a rule was broken, the weekly report carried a sell signal. It gave the units, what the sale would return after fees, the gain or loss, and how that would be taxed if sold now rather than after the 12-month mark. In Australia a gain on something held for under a year is taxed in full. After a year, half of it is. A sell inside 12 months always said so.
10. The ledger that refuses to lie
Everything else could be wrong for a week and recover. The ledger could not. It was built on three rules.
- Append only. Picks, calls, transactions, prices and audits are added, never overwritten. Every figure keeps its source.
- Undo and backups. A copy before every change, and a dated backup at the start of every scheduled run.
- Score every call. Each purchase is credited to the most recent call that named it. An order more than 10% away from its call is flagged.
Once a month I exported a transaction report from Sharesies and dropped it in an inbox folder. The reconciliation run imported it, de-duplicated it and matched it to the calls. Then it answered five questions: did I act on each call, how did the names offered do, did I act on each sell signal, how is the money tracking, and what does it look like against VGS bought on the same days.
This is where the finance class came in most directly. The ledger had a Finance sheet and a command that worked through the measures from the EMBA finance subject on my actual holdings. It covered each holding’s average and compound return, its volatility, its beta against VGS (how far it tends to move when the market moves), the return the capital asset pricing model says it should earn for that risk (Sharpe, 1964), Jensen’s alpha, the excess over that required return (Jensen, 1968), the Sharpe ratio, and each holding’s share of the portfolio’s total risk. It is one thing to learn those in a lecture theatre. It is another to see on 27 October that Elastic was 48.7% of my money and 59.5% of my risk, and that my portfolio’s beta was 1.88. With a beta of 1.88 I should expect it to move almost twice as far as the market, in either direction.2 That is the tool Professor Masood made me want to build: one that watches, and tells me plainly what I am holding.
11. Testing the tester
An AI that writes your financial records needs testing more than you do. From the first hour the agent kept a test suite that ran the whole system against made-up data in a throwaway folder, never the real ledger. It covered:
- the return calculation and the fee formula
- day-first date parsing, because Australian dates are day first and American ones are not
- exchange time zones
- CSV import and de-duplication
- the scoring of every call.
The suite grew as the rules changed. It started at 71 tests on 28 September and reached 264 by 7 October, across six versions of the data model (Figure 5). Each new version came with new tests.
The bugs the tests did not catch were the interesting ones, because they came from the real world rather than the code:
- The Amount column. Sharesies sometimes left the fee out of the Amount column in its export. The first VGS purchase briefly looked like it cost less than $200, until the importer learnt to add the fee back.
- Time zones. Trade times arrived in UTC and had to be read on the exchange’s own clock.
- Adjusted prices. Yahoo quietly adjusted a past VGS close, and the agent restored the raw value.
- A Numbers file. One month’s export arrived as a Numbers spreadsheet instead of a CSV, so the rows were copied out unchanged and imported.
None of these is clever. All of them would have made the numbers wrong in a way I would not have noticed.
Part III: What the data said
12. Called against bought
The agent made seven calls in the month (Figure 3): five weekly calls, a plan for $400 of extra money, and the first list of climbers. The last weekly call, week 04, was still open on 27 October.
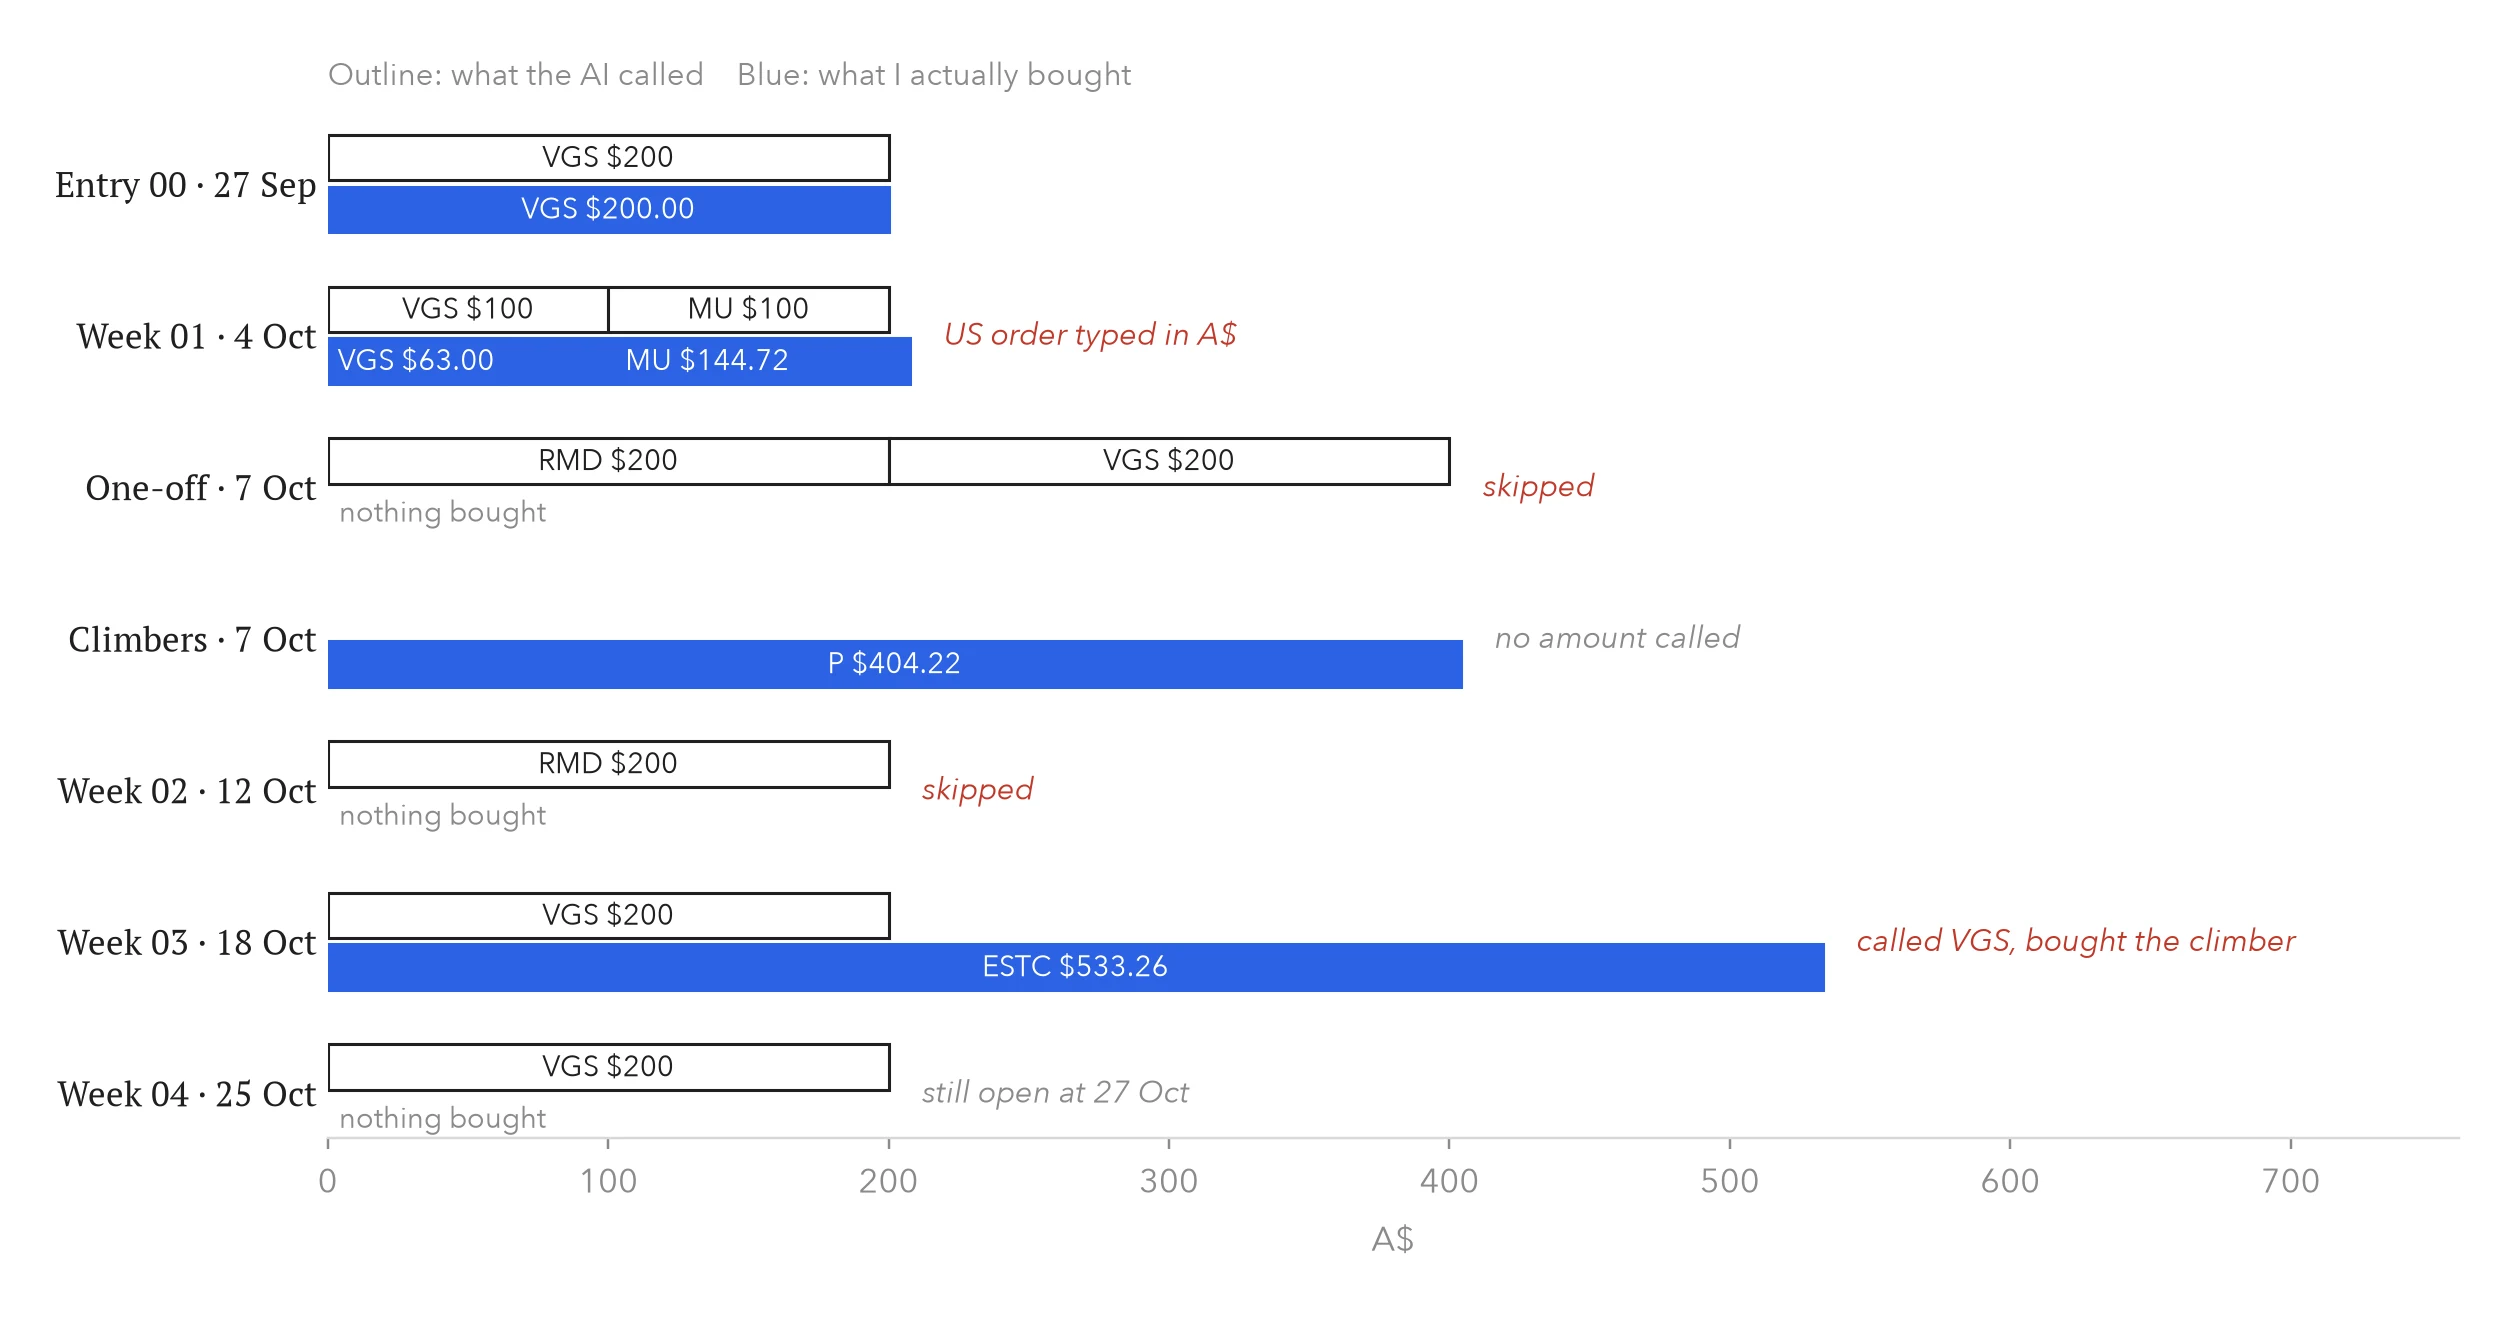
Figure 3. What the AI called against what I bought, for every call to 27 October. Outline bars are the call. Blue bars are the money I actually put in, at the Australian dollars Sharesies took from my wallet.
Of the five calls that could be scored, I acted on three, a follow rate of 60%.3 The pattern in the misses is plain in the figure.
- Every core name got less than it was called for, or nothing. VGS got $63 of a $100 call in week 01. ResMed was called twice, for $400 in all, and got nothing.
- Every bold US name got more. In week 01 Micron got A$144.72 against a $100 call. The ledger flagged it as 45% over. That is about what typing 100 into a US dollar order costs, so I had probably entered Australian dollars on a US dollar screen. The agent changed the buy table that day so every US line gives the US dollar figure to type, in bold.
- Week 03 is the clearest case. The call was $200 of VGS, made specifically to bring the bold side back down. Instead I put A$533.26 into Elastic, one of the week’s climbers, across four orders. That is more than two and a half times the call, into the side that was already nearly twice its ceiling.
The ledger kept score of the calls I skipped as if I had followed them, a shadow portfolio. On 27 October the $600 I did not put into ResMed and VGS would have been worth $626.36, up 4.4%. Of the eight climbers offered, I bought two (Everpure and Elastic), passed on four, and two were still open. The two I took were up 1.8% on average in Australian dollars since they were offered. The four I passed on were up 0.5%. Over days and weeks, that is noise.
The useful finding is about me, not the stocks. Given a safe call and an exciting option, I took the exciting option every time. The ledger made that visible in a way my memory never would have. By 27 October the bold side, capped at a third of the portfolio, was 78.8% of it.
13. The money
A$1,232.75 went in over the month. At the close on 26 October the portfolio was worth A$1,203.04 in shares and A$0.58 in cash, a loss of A$29.13, or 2.4%. The same dollars put into VGS on the days they arrived would have been worth about A$1,210, so the portfolio was about A$8 behind the index (Figure 4).
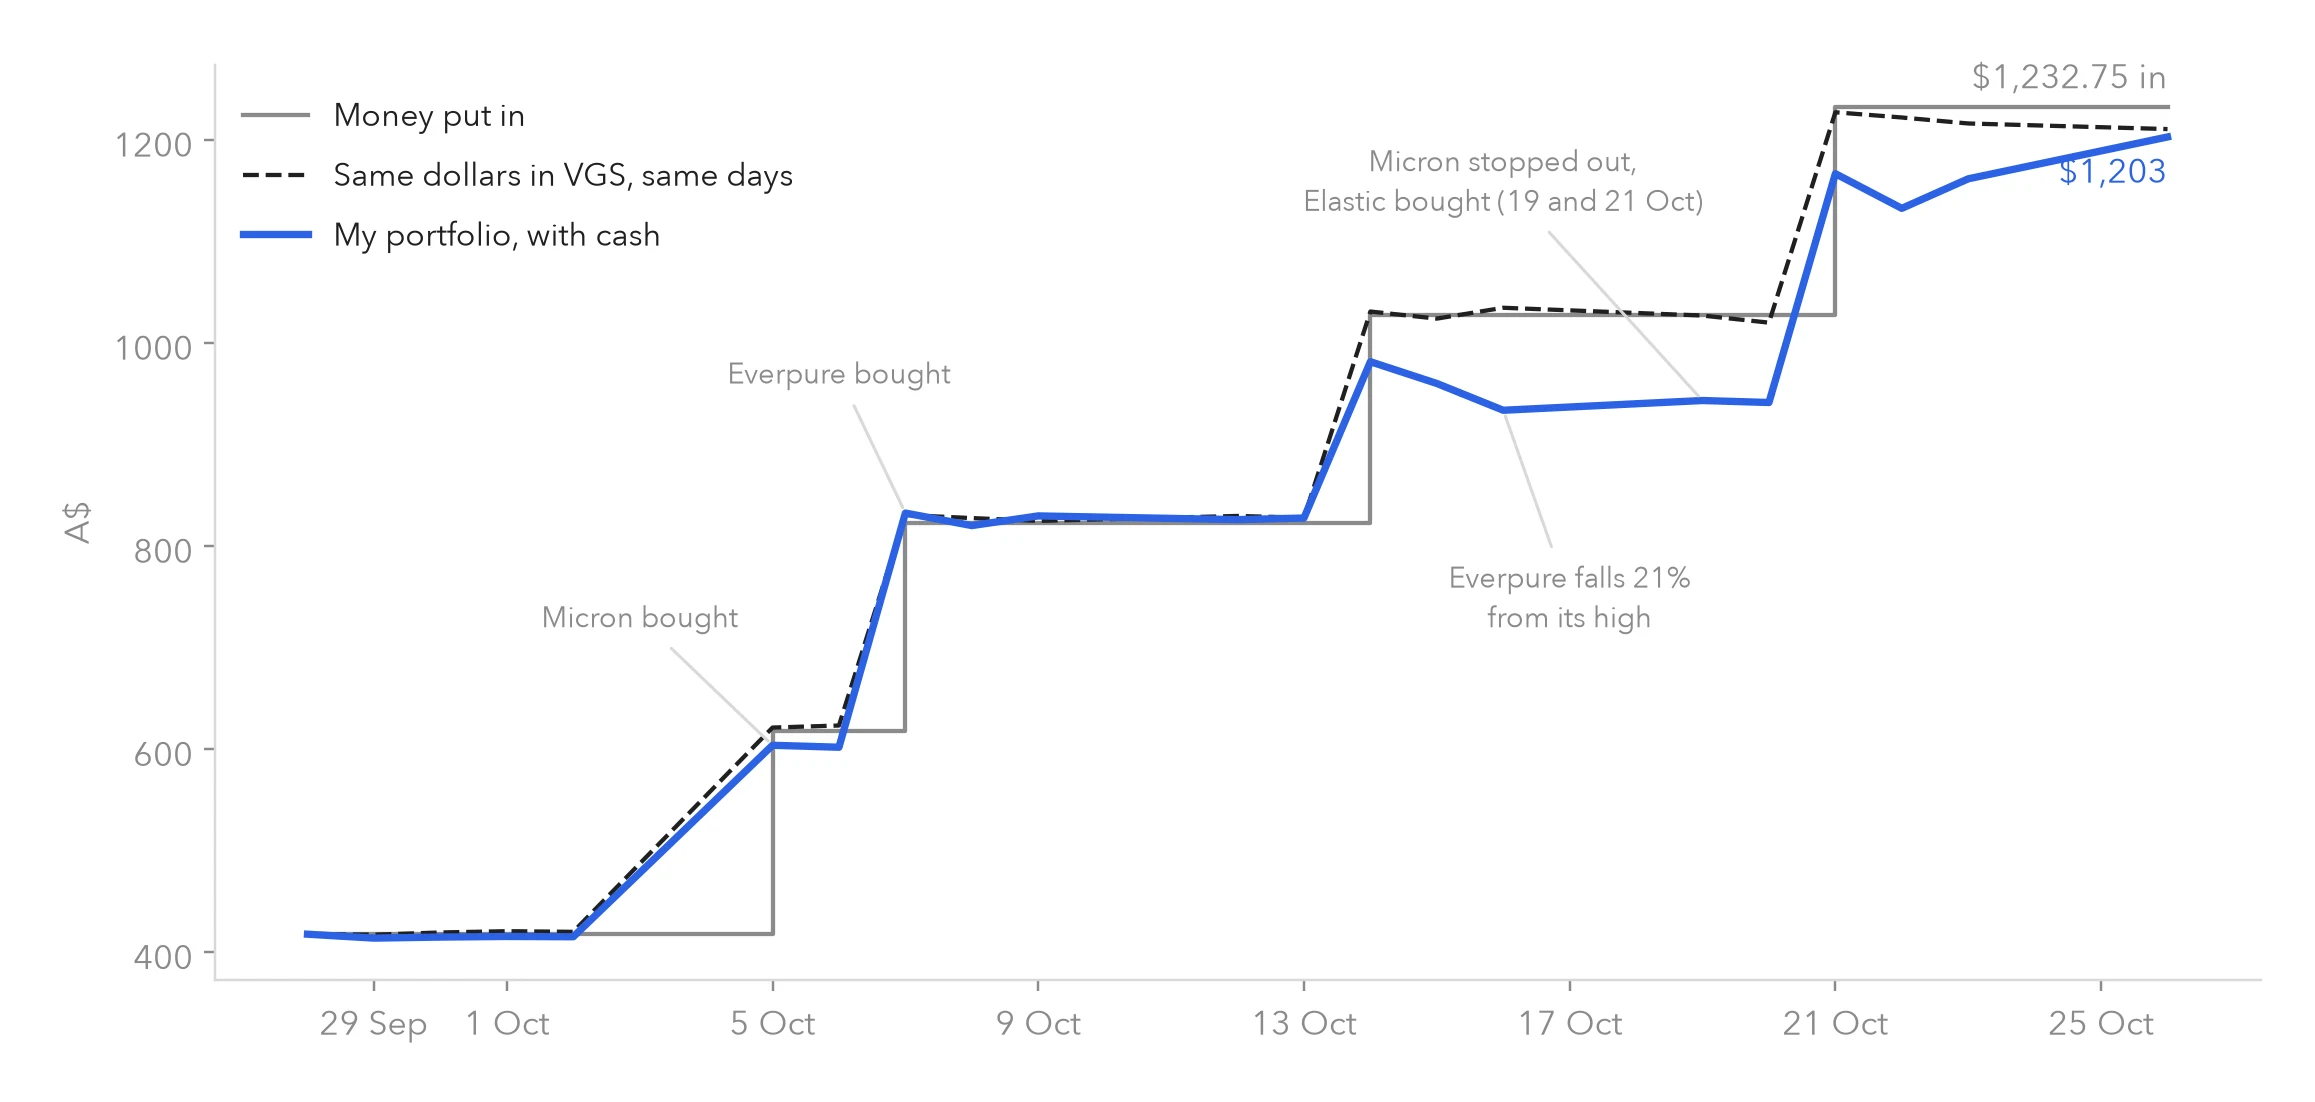
Figure 4. Money put in, portfolio value with cash, and the same dollars put into VGS on the same days, at each daily close from 28 September to 26 October 2026. Rebuilt from the Sharesies wallet and transaction reports and Yahoo closes. It lands within a dollar of Sharesies’ own figure.
Three moves explain almost all of it.
- Micron. Bought on 5 October for A$144.72. It closed at US$878.84 on 16 October, below its US$900 stop. The Sunday report carried a sell signal, and I sold the next trading day at US$914.27, for a loss of A$22.06 after 14 days.4 Selling on the signal was the first time the sell table did its job with real money. A week later Micron was within 1.2% of my sale price. The stop neither saved nor cost me much. It did exactly what it was written to do.
- Everpure. Bought on 7 October for A$404.22. It peaked six days later and fell 21% from that high. On 22 October it closed at US$121.20, under its US$122 stop. The sell signal went out on 25 October. I had not acted on it by the end of the experiment. The stock had already closed back above its stop the very next day. That is the hardest kind of signal, and the ledger left it open rather than pretending it had been decided.
- Elastic. The week 03 climber I over-bought. By 26 October every one of its four parcels was up, between 7.9% and 13.3%, and that pulled the total most of the way back.
Then there was a finding I did not expect. The old ledger’s own report on 27 October said the portfolio was $30.99 ahead of VGS. A recount the same day from Sharesies’ wallet report said about $8 behind. Both used the same trades. The difference was one definition. The ledger counted money in as the sum of every purchase, $1,343.31. That treated the Elastic bought with the Micron sale proceeds as new money, when it was the same money going round again. It also converted US trades at an estimated exchange rate. Counting the dollars I actually deposited flipped the sign of the result.
That was the most important number of the month. A system can be accurate to the cent on every trade and still answer the wrong question. “Am I beating the index?” depends entirely on what you call the money you put in.
14. The rules kept moving
The agent took its own data model through six versions in the first ten days (Figure 5). Each version was a response to something I asked for or something the real world threw at it:
- v2. One call a week.
- v3. The $200 split across two names, with a fee tracker.
- v4. Importer fixes.
- v5. Core and bold.
- v6. US amounts to type, and calls for extra money.
- v7. Climbers, and back to one pick.
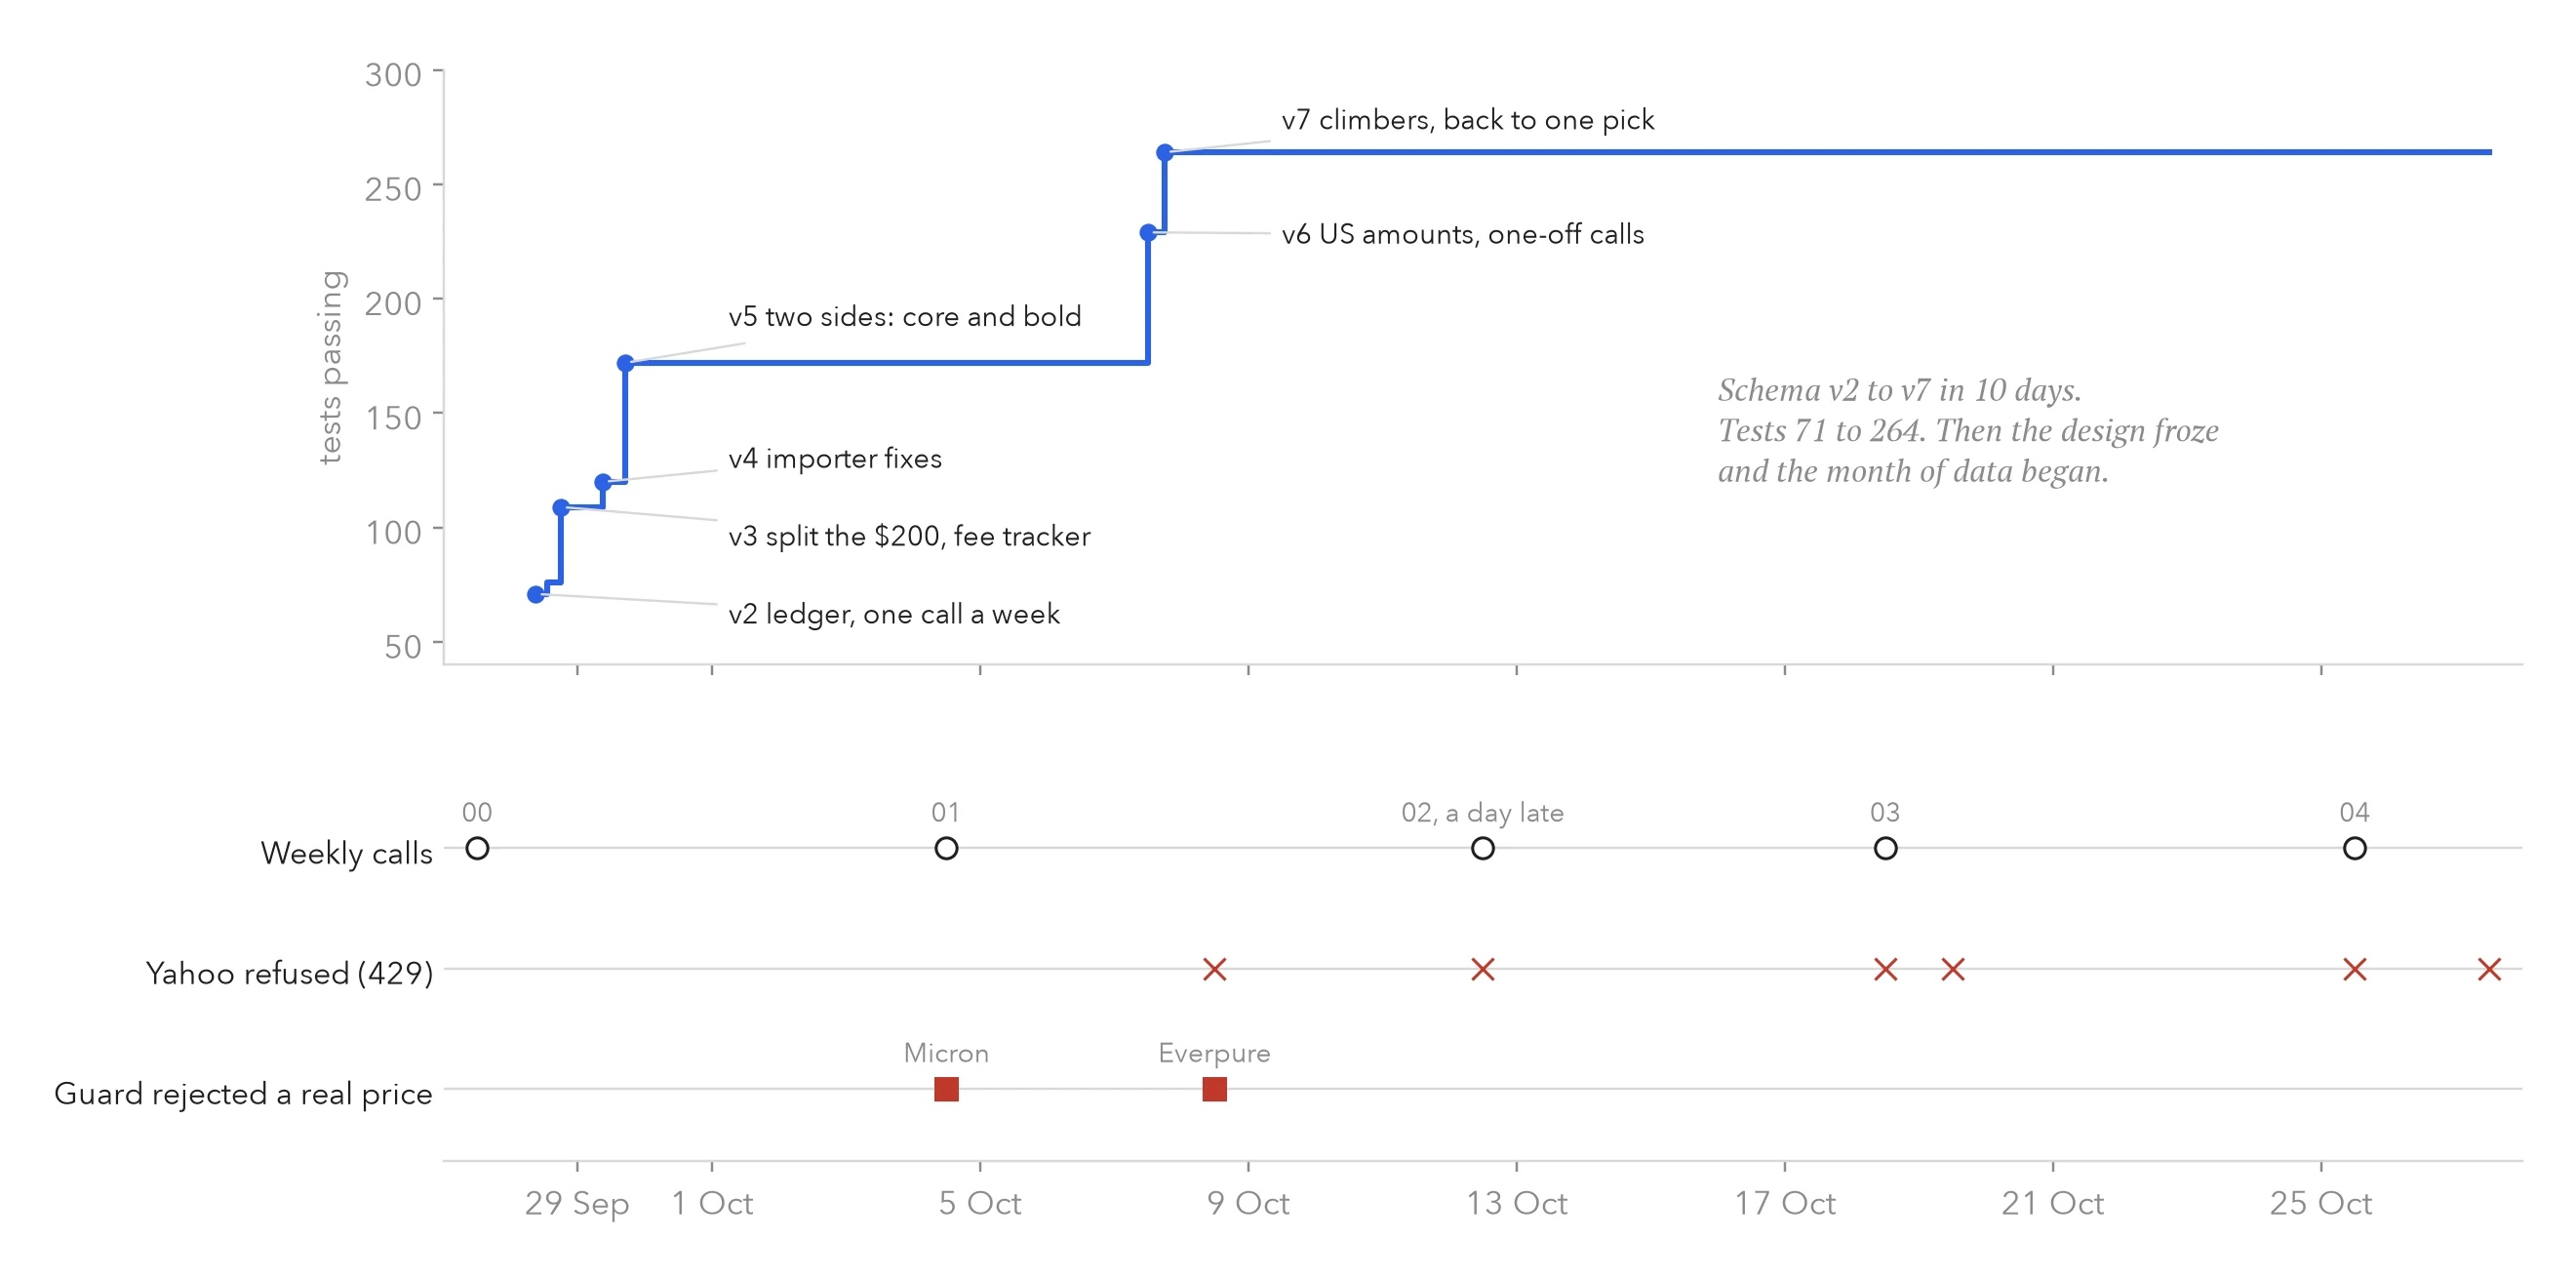
Figure 5. Top: the agent’s test suite and data model versions, from the first setup on 28 September to the last change on 7 October. Bottom: the weekly calls, the days Yahoo’s price service refused requests (HTTP 429, too many requests), and the two days a safety check rejected a genuine price.
Building fast was the right call. It is why the system worked at all by week 01. But it cost the month its value as an experiment. Weeks 00 and 01 were run under different rules from weeks 02 to 04, so no rule ran long enough to be scored on its own. Five calls under three different designs give five anecdotes, not a result.
15. Friction
The month also showed how much of an agentic system is plumbing.
- Yahoo said no six times. On 8, 12, 18, 19, 25 and 27 October, Yahoo’s price service refused the agent’s requests. Each time it fell back to a second route to the same data on my Mac, and the run still finished. A system that depends on one free data source will fail on the day it matters.
- A safety check rejected real prices. The ledger refused any price far from a stock’s 50-day or 200-day average, to catch bad data. On 4 October it rejected Micron’s genuine close. On 8 October it rejected Everpure’s, 46% above its 50-day average. The agent checked both against a second source and recorded them with a note. A guard built for calm stocks treats a momentum stock as an error. The bold side was, by design, full of them.
- A run did not happen. The Sunday run on 11 October did not fire, and week 02 ran on the Monday. The Mac has to be awake, online and running the Claude app at those times.
- The export arrived late. On 27 October my export reached the inbox a few minutes after the run had checked it, while it was still syncing. The first report said nothing was waiting. A second pass imported it and wrote a revised report beside the first, without overwriting it.
- An order did not fill. An Elastic order placed on 18 October had not filled when the export was taken, so week 03 was briefly scored as skipped.
- Fees were not what I thought. About $16 in the first month, more than 1% of the money put in, mostly brokerage and currency conversion. Two Elastic orders carried about $4.86 of brokerage even though I was on a monthly plan, which suggests the plan’s order allowance had run out. The ledger caught it. I would not have.
16. What one experiment cannot tell you
Table 1 goes back to the unknowns in Figure 1 and says what the first experiment answered.
Table 1. The unknowns from Figure 1, what the first experiment answered, and what stays open.
| Unknown | What the first experiment answered | What stays open |
|---|---|---|
| Scout | Nothing. Ideas came from screens the agent ran and names I liked | Where good ideas actually come from |
| Shortlist | A conviction list with a reason and a date for every name | When a name should leave the list. It grew to 15 in a month |
| Look for, patterns | Signals beside every name, and dossiers that show how a thesis changed | Whether any signal predicts anything |
| Theory | Two sides, core and bold, with a ceiling | Which theory works. One call a week can only test one at a time |
| Buy | One call of record a week, the amount to type, enforced by the ledger | Whether the call was a good one |
| Monitor | Daily prices, alerts and a dashboard. This works | Nothing major |
| Predict | Targets on every bold name | Whether targets mean anything |
| Sell | Stops and sell signals that fire on rules, with tax shown | Whether stops beat holding |
| Reject, log, revive | Screened-out names keep a file | No reason codes, nothing to bring a name back |
| Learn | Every call scored, a shadow portfolio, a follow rate | No result. Too few calls, too many rule changes, one benchmark |
The pattern is clear. The core works. The AI can watch a portfolio, record the truth to the cent, hold me to my own calls and catch my mistakes. Professor Masood’s tool exists. But it cannot tell me whether any of its ideas were good, because the experiment was built to make one decision a week. To learn which ideas work, I need to run many of them at once, each with fixed rules, each scored against VGS with the same dollars on the same days, for long enough that luck washes out. That is impossible with $200 of real money a week, and it is free on paper.
That is the gate for Paper 2.
Part IV: The road ahead
17. Six papers, six gates
Figure 6 is the rough map of the series. Each stage is a system built and tested on its own, answering one cluster of the unknowns in Figure 1. Each gate is passed on results, not effort. The later stages are deliberately vague. They will change as each experiment comes back.
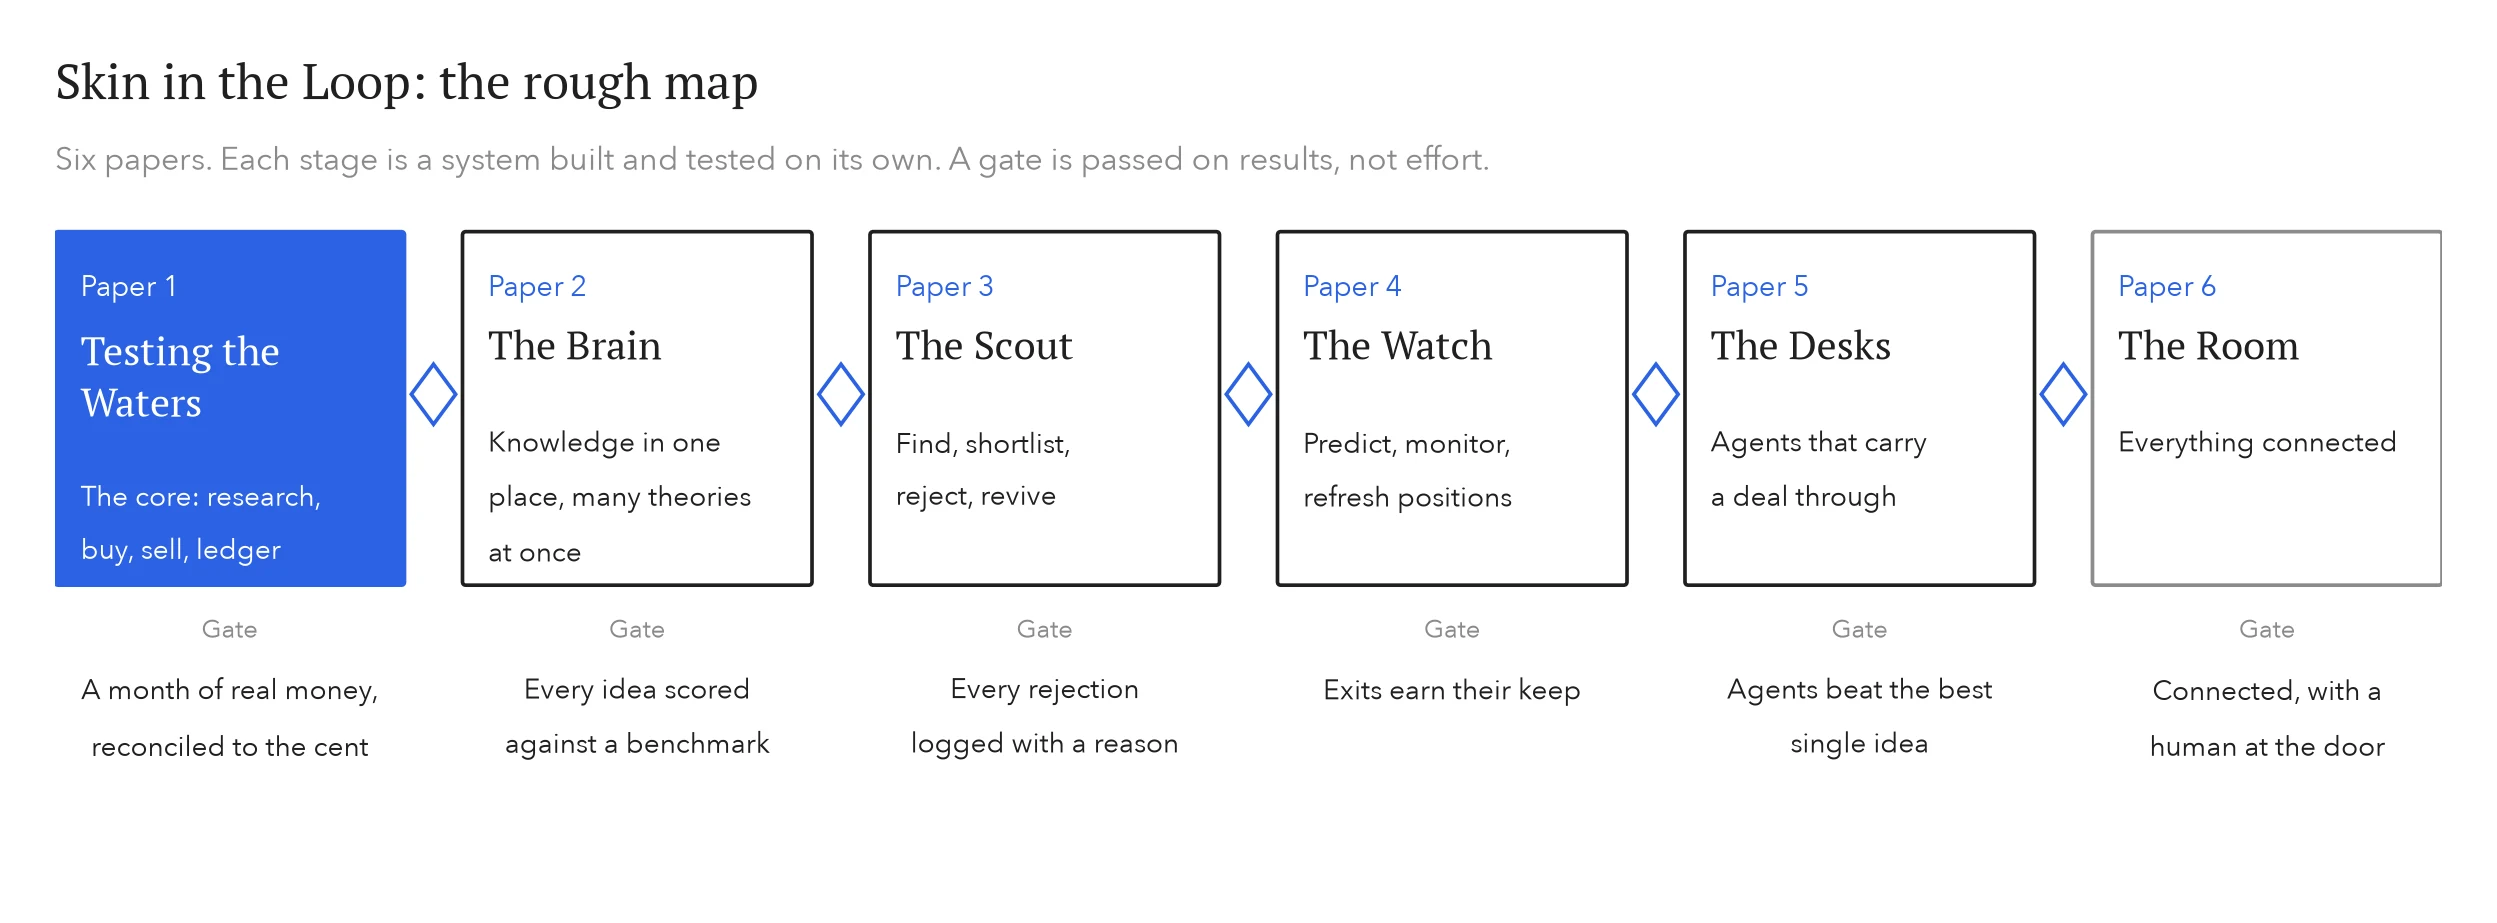
Figure 6. Skin in the Loop, the rough map. Paper 1, this paper, built the core. Each diamond is a stage gate.
- Testing the Waters. The core: research, buy and sell tables, and a ledger. Gate: a month of real money reconciled to the cent. Passed on 27 October 2026, with the definition of money in fixed on the same day.
- The Brain. The research moves from a folder into a knowledge base in Obsidian, and many investing theories run at once on paper. Gate: every theory scored against VGS on the same days.
- The Scout. Finding, shortlisting, rejecting and reviving ideas. Gate: every rejection logged with a reason.
- The Watch. Predicting, monitoring and refreshing positions. Gate: exits that earn their keep.
- The Desks. Agents that carry a deal from lead to decision, the way Sebastian described deal flow. Gate: agents that beat the best single idea.
- The Room. Everything connected, with a human at the door.
18. Limitations
- One month is nothing. Thirty days and five scored calls cannot say anything about returns. They were never meant to. Every return figure in this paper is a description of what happened, not evidence of skill.
- One person, one broker, one market. The friction in Section 15 is specific to Sharesies, Yahoo and a Mac that has to stay awake. Another setup would have other friction.
- The rules moved. Six data model versions in ten days mean no single rule was tested cleanly.
- I was part of the experiment. I over-rode the system in the direction of excitement every time. A different person would have produced a different month from the same agent.
- Survivorship and hindsight. Every name the agent offered was chosen from stocks listed today, and the climbers were chosen because they had already climbed.
Acknowledgements
This work started in a classroom. Thank you to Professor Nadia Masood, whose finance teaching made me want to build a tool with AI that watches a portfolio and tells the truth about it. Thank you to Sebastian Teegen Andreson, who got me thinking about agentics in finance and the flow of how deals are found and moved, which is where this series is heading. And thank you to my EMBA cohort. Your interest in finance, and the honest range in how literate we all are in it, is the reason this paper explains its terms as it goes.
References
Cooper, R. G. (1990). Stage-gate systems: a new tool for managing new products. Business Horizons, 33(3), 44–54.
Jensen, M. C. (1968). The performance of mutual funds in the period 1945–1964. Journal of Finance, 23(2), 389–416.
Ries, E. (2011). The Lean Startup. Crown Business.
Sharpe, W. F. (1964). Capital asset prices: a theory of market equilibrium under conditions of risk. Journal of Finance, 19(3), 425–442.
Taleb, N. N. (2018). Skin in the Game: Hidden Asymmetries in Daily Life. Random House.
Footnotes
-
Every figure in this paper comes from the experiment’s own records: the run log (one line per run), the weekly and monthly reports the agent wrote, the ledger database, and the Sharesies holdings, transaction and wallet reports to 26 October 2026, checked on 27 October. Prices are daily closes from Yahoo Finance. Dollars are Australian unless marked US$. This is a record of an experiment, not financial advice. ↩
-
Measured on 52 weekly returns from 24 October 2025 to 23 October 2026 for the holdings as they stood, in Australian dollars, not on my own few weeks of ownership. A year of weekly returns is a small sample, and alpha moves the most. ↩
-
Week 03 counts as acted on because the money went into a name the call offered, even though it was not the name it asked for. The week 01 split is scored line by line. The climbers list carried no amount and is not scored. ↩
-
The ledger first recorded this loss as A$22.94, converting at its own estimated exchange rate. Sharesies’ wallet report shows the actual figure, A$22.06. The A$ amounts for every US trade in this paper are taken from the wallet report. ↩
The Brain
Gate: Every idea scored against a benchmark. See the whole series.
Got a live strategic question? Tell me about it.
Comments
(Comment with your GitHub account. I read every one and reply. Be kind and specific.)