writing · Paper · 22 October 2026
A second brain for strategy
How a strategist-owned knowledge graph and an AI thinking partner challenge assumptions and test claims with evidence
By Manoj Tirukoti
I built this second brain as way to codify my knowledge and aid my own strategic thinking. The data collection, the theses and the conclusions are mine. What AI added was challenge and evidence, and the knowledge graph kept both honest. Every challenge had to point to a note in the graph, so the agent could not argue from general opinion or a pile of documents. In four interrogation sessions it questioned me one point at a time and pushed back on vague answers, and 49 of my answers became data points I could test. It searched for evidence against my position as well as for it, and 41 of the 151 data points now challenge the argument they sit beside. The sharpest challenge was a pattern I had not seen: my own sources leaned towards support, while public research leaned against. That gap between my inside view and the outside view became a question I had to answer before approving a thesis. The AI tested my thinking, and the graph made every test traceable.
Written during my Executive MBA, October 2026.
Abstract
AI can help test strategic thinking, but chat and document search forget between sessions, cannot show where a figure came from, and miss evidence that does not resemble the question. This appendix reports a simple experiment: while doing all the strategic work myself, I codified what I knew into a knowledge graph and built a thinking partner on top of it. The graph holds 372 notes and 4,390 links. Every one of its 151 data points was collected by me with its context and links, across more than 150 hours of linking and concept work. The AI partner has two jobs: to challenge conclusions already reached, and to find evidence that tests claims. Every challenge must point to a note in the graph, not to a pile of documents. On the reference build, keyword search surfaced 35% of the evidence linked to each argument, while traversal read all of it from 8% of the vault. Research from universities, Microsoft and Anthropic points the same way.
Keywords: knowledge graph, second brain, thinking partner, codified knowledge, evidence, strategy
A.1 Introduction
Imagine testing a strategic claim with AI, such as whether a business unit should exit a product line. General chat draws on the conversation and its training, so it offers no trail back to evidence. Document search (Lewis et al., 2020) fetches the passages that look most like the question, so it finds what resembles the claim and misses what tests it, counter-evidence especially. Neither follows the path a strategist follows: from the situation, to the tools that test it, to the evidence for and against, to the source behind each figure.
The root of the problem is the same in both cases. The knowledge is not held in a structure that records how each fact relates to the question. Hence the fix belongs at the root: build that structure as a graph the strategist owns, and let the model move through it.
The reference build, the EMBA Vault, was a simple experiment in building a thinking second brain, run between 17 September and 7 October 2026. I did the strategic work myself: the reading, the data collection, the analysis and the theses. Alongside it, I codified that knowledge into a graph and built a thinking partner whose jobs are to challenge my conclusions and to find evidence that tests my claims. I intend to build on it for all my strategic work. This appendix makes six contributions:
-
A design in which the strategist decides, the graph remembers, and the agent finds evidence and challenges from the graph, with the process that builds it (A.3 to A.5).
-
Evidence that the design beats chat and document search, from a test on the reference build and from university, Microsoft and Anthropic research (A.2, A.6).
-
An account of the human effort the design needs, and why it cannot be delegated (A.8).
-
A view of how the method lifts strategists across six tiers of capability, and of where knowledge graphs already work in industry (A.10, A.11).
-
A plain explanation of plain graphs, knowledge graphs and knowledge graphs with inference, and what each means for strategy (A.12).
-
The practical foundations the method needs, and why they are barriers today (A.13).
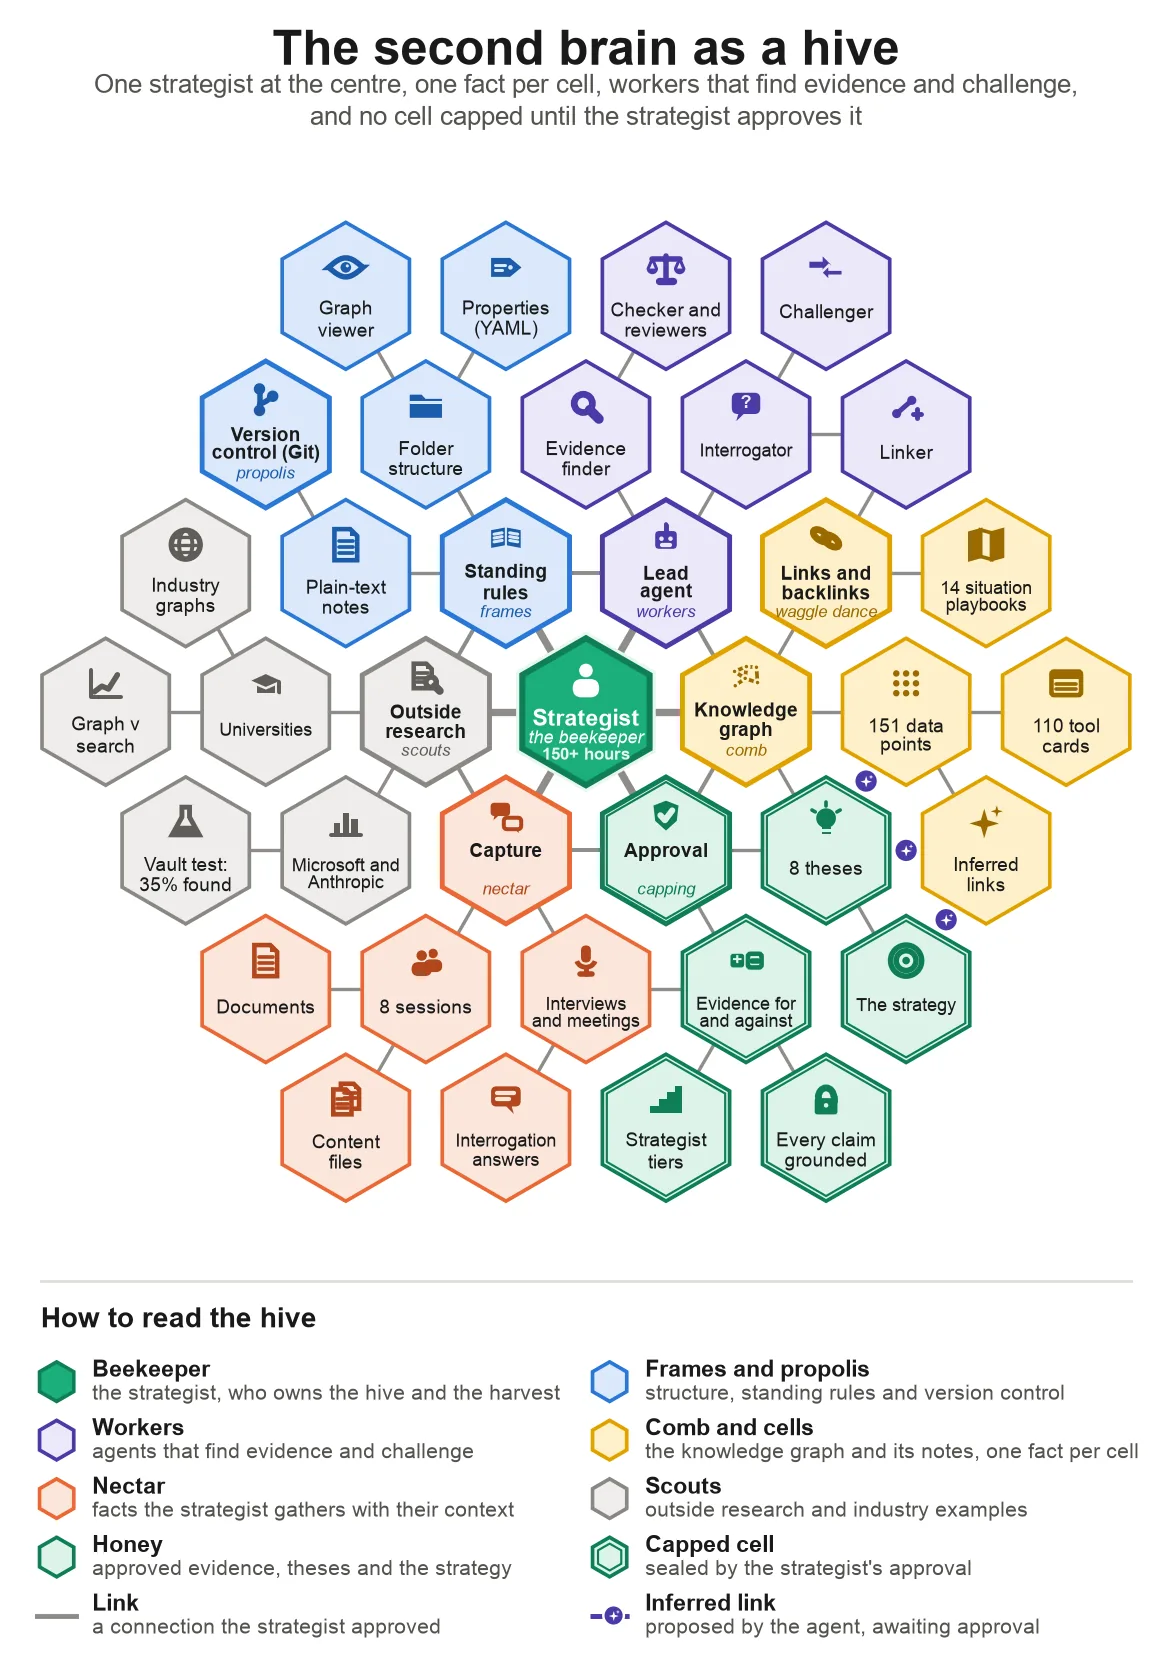
Figure A.1. The second brain as a hive. Dashed violet links are inferences the agent proposes. Double borders mark cells the strategist approved.
Figure A.1 shows the whole system on one page, and it maps closely onto a beehive. The strategist is the beekeeper. Notes are cells holding one fact each, and together they form the comb. Facts arrive as nectar, agents are workers that find evidence and challenge, links are the waggle dance, version control is the propolis, and a cell is capped only when the strategist approves it.
A.2 Related research
Three bodies of research bear on the design. Table A.1 lists the studies by source and Figure A.2 charts four of them.
Graphs against document search. University and Microsoft studies agree that graphs win when a question needs several facts joined up, comparisons across time, or a view of a whole body of material. Plain retrieval keeps a small edge on single-fact lookup (Han et al., 2025). Strategy questions are rarely single-fact lookups.
Context, memory and agents. Anthropic’s research explains why structure helps: chunks that lose their context fail retrieval more often, and agents do better holding light references and memory outside the model. Microsoft’s research finds the reverse in chat: models get lost as a conversation runs on (Laban et al., 2025).
People and AI. AI help lifts weaker performers most, but the same help can blunt thinking when it does the thinking. The design takes both lessons: the agent challenges and finds evidence, and the strategist does the thinking.
Table A.1. Research that bears on the design, by source.
| Source | Study | Finding |
|---|---|---|
| Michigan State University | Han et al. (2025) | Graph retrieval ahead on multi-hop (71.2% v 65.8%) and temporal questions (49.1% v 25.7%). Document retrieval ahead on single-hop lookup (68.2 v 65.4 F1) |
| Ohio State University | Gutiérrez et al. (2024) | Graph-based memory up to 20% better on multi-hop questions, and 10 to 30 times cheaper than iterative retrieval |
| Harvard Business School, with BCG | Dell’Acqua et al. (2023) | With GPT-4, below-average consultants improved 43% and above-average 17%. Outside the model’s frontier, 19 percentage points less likely to be right |
| Stanford University and MIT | Brynjolfsson et al. (2025) | 14% higher productivity on average, 34% for novice and low-skilled workers |
| University of Pennsylvania | Bastani et al. (2025) | Unguarded GPT-4 lifted practice scores 48% but cut scores on a later unaided test by 17%. A guarded tutor avoided the harm |
| Carnegie Mellon University and Microsoft Research | Lee et al. (2025) | Among 319 knowledge workers, more trust in AI went with less critical thinking |
| Microsoft Research | Edge et al. (2024) | GraphRAG won 72 to 83% of comparisons with vector search on comprehensiveness |
| Microsoft Research and Salesforce | Laban et al. (2025) | Across six tasks, 39% lower performance over several turns than in one |
| Anthropic | Anthropic (2024) | Keeping context in chunks cut retrieval failures by 49%, and by 67% with reranking |
| Anthropic | Anthropic (2025a) | Recall falls as context grows. Agents should hold light references and load data just in time |
| Anthropic | Anthropic (2025b) | Memory outside the context window, with context editing, lifted agentic search 39% |
| Anthropic | Anthropic (2025c) | A multi-agent research system outperformed a single agent by 90.2% |
| Anthropic | Anthropic (2025d) | Citations tie each claim to its source. One customer cut source errors from 10% to 0% |
| Anthropic | Anthropic (2025e) | A model’s default is to say it does not know. Errors appear when familiarity overrides it |
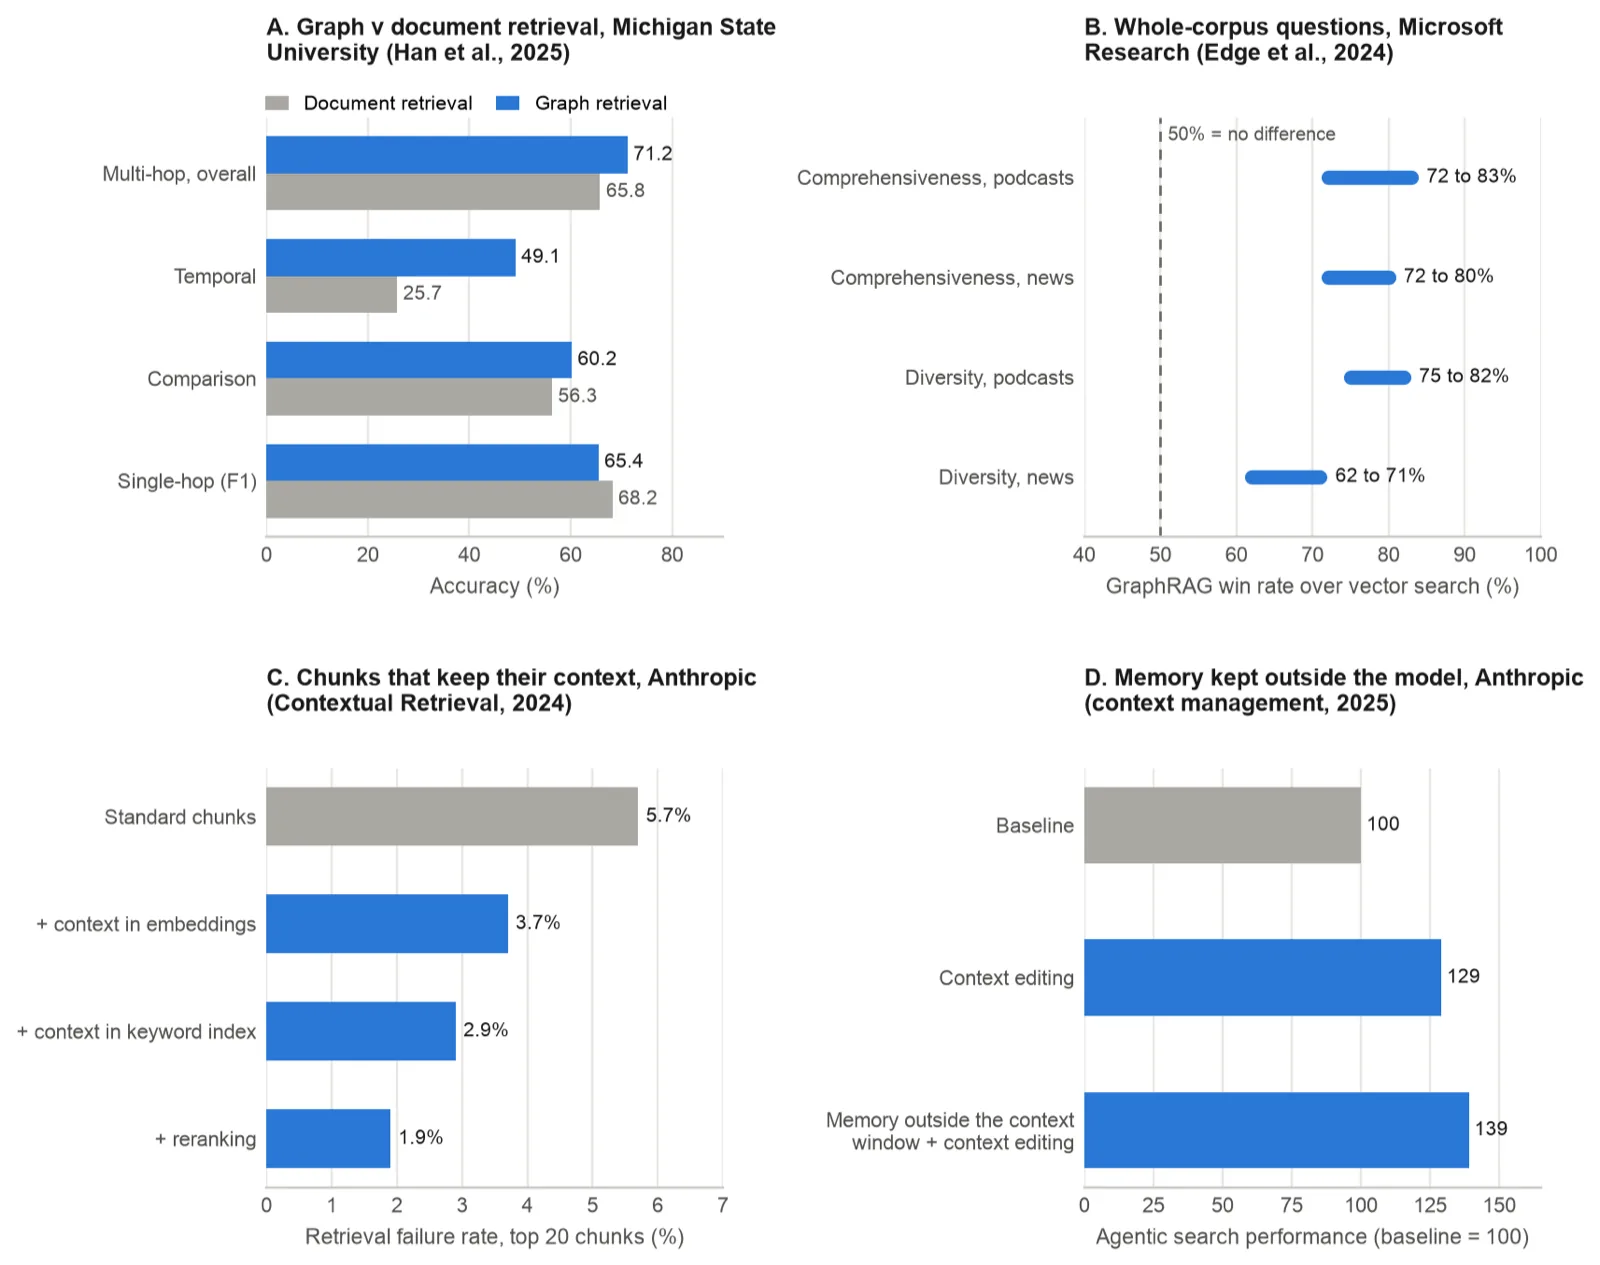
Figure A.2. Four results: graph against document retrieval (A), GraphRAG win rates (B), retrieval failures when chunks keep their context (C), and agent performance with memory outside the model (D).
A.3 The system: strategist, graph and agent
The second brain is an old idea, from Bush’s memex (1945) and Luhmann’s slip box to Forte’s method (2022). What is new is a reader fast enough to walk it.
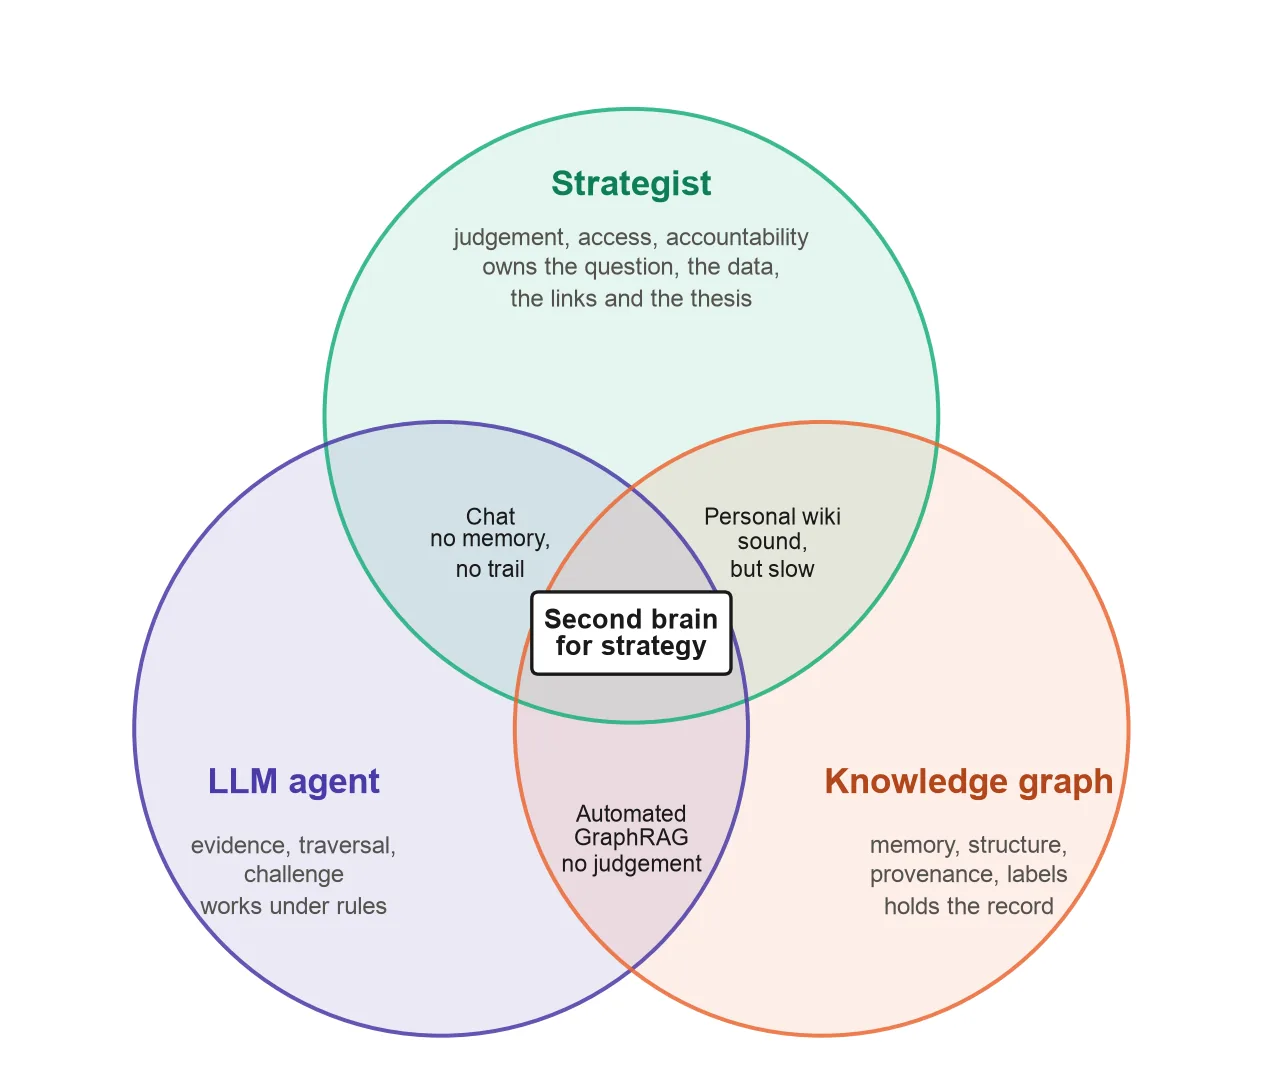
Figure A.3. Three parts, one system. Any two without the third fall back to something weaker.
Table A.2. What each part brings, cannot do alone, and owns.
| Part | Brings | Cannot do alone | Owns |
|---|---|---|---|
| Strategist | Judgement, access to first-hand evidence, accountability | Hold 372 notes and 4,390 links in working memory, or re-check every label each session | The question, the application, the data, every approved link, the thesis and the strategy |
| LLM agent | Evidence finding, traversal, questioning, challenge | Remember between sessions, know what is true for this organisation, take accountability | Nothing. It works under the strategist’s rules |
| Knowledge graph | Memory, structure, provenance, labels, visible gaps | Think or decide | The record |
Take one part away and the system falls back. Strategist and LLM without the graph is chat: quick, but it forgets and cannot show where a figure came from. Strategist and graph without the LLM is a personal wiki: sound, but 4,390 links are too many to walk by hand each time the question changes. LLM and graph without the strategist is automated GraphRAG: fast, but a machine draws the links and nobody owns the conclusion. In the centre, the strategist thinks, the graph remembers, and the agent finds the evidence and does the challenging.
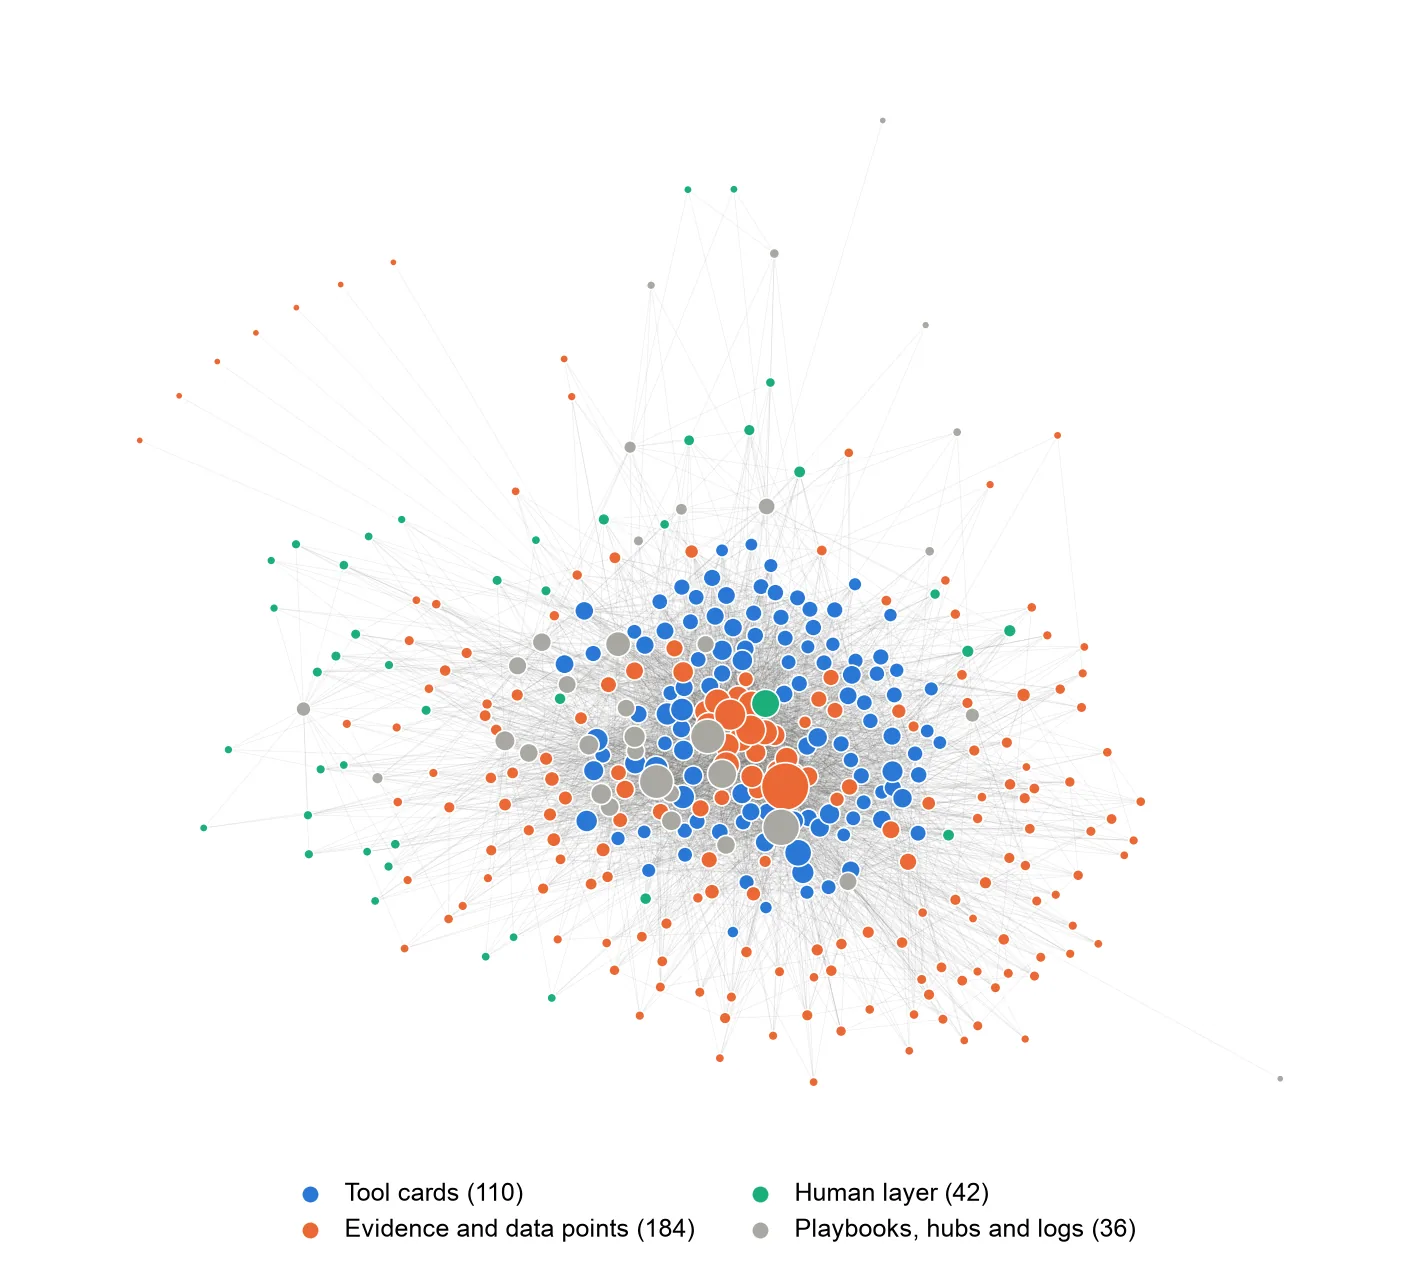
Figure A.4. The reference graph: 372 notes and 4,390 links. Tool cards (blue) sit at the centre, data points (orange) ring them, and the strategist’s own notes (green) sit at the edge.
Every note is reachable: there are no orphans and the graph is one connected piece. Any note is on average 2.16 links from any other, so the evidence behind a claim is two or three steps away.
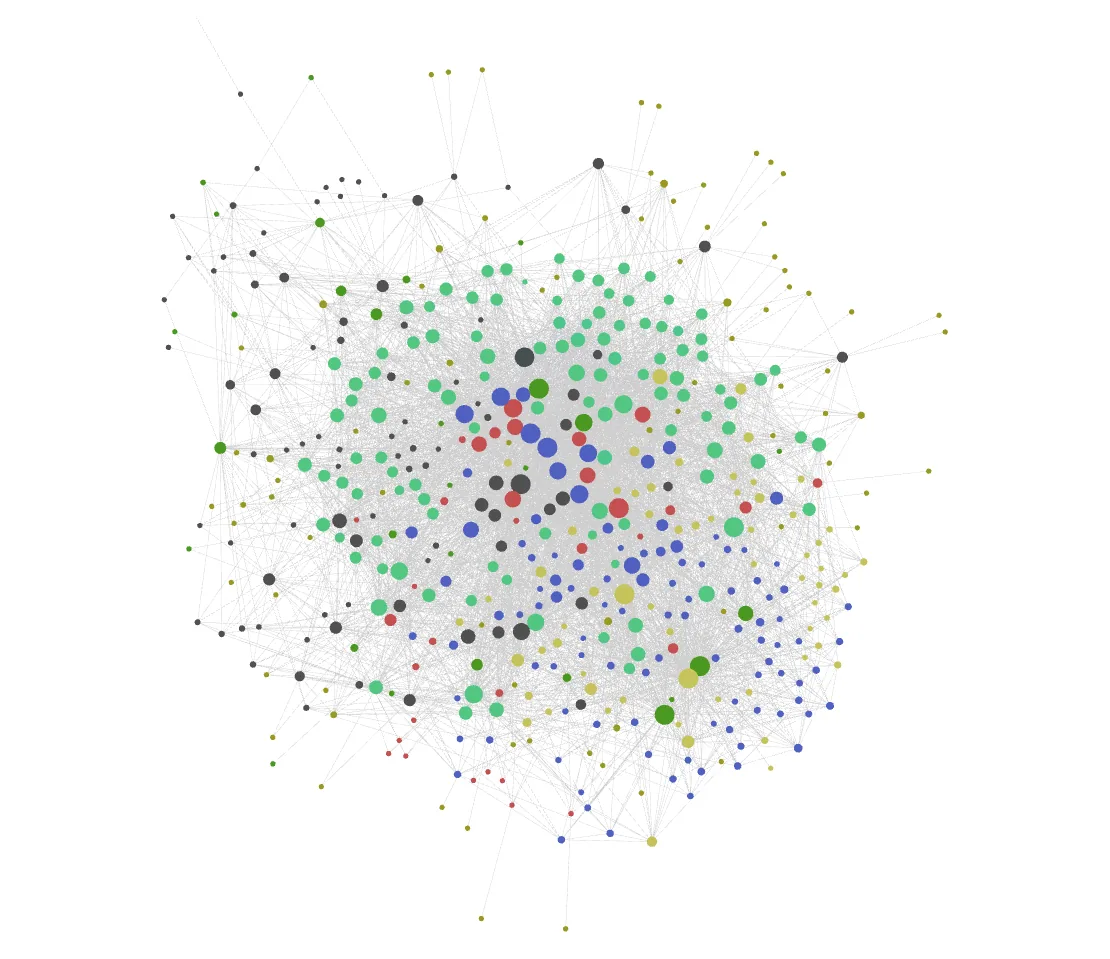
Screenshot S1. Full graph view of the EMBA Vault in the graph viewer.
A.4 How the graph is built
The graph is built in a loop of eight steps (Figure A.5). The strategist captures, labels and decides. The agent finds evidence, challenges and tests, and every link it suggests waits for the strategist’s approval.
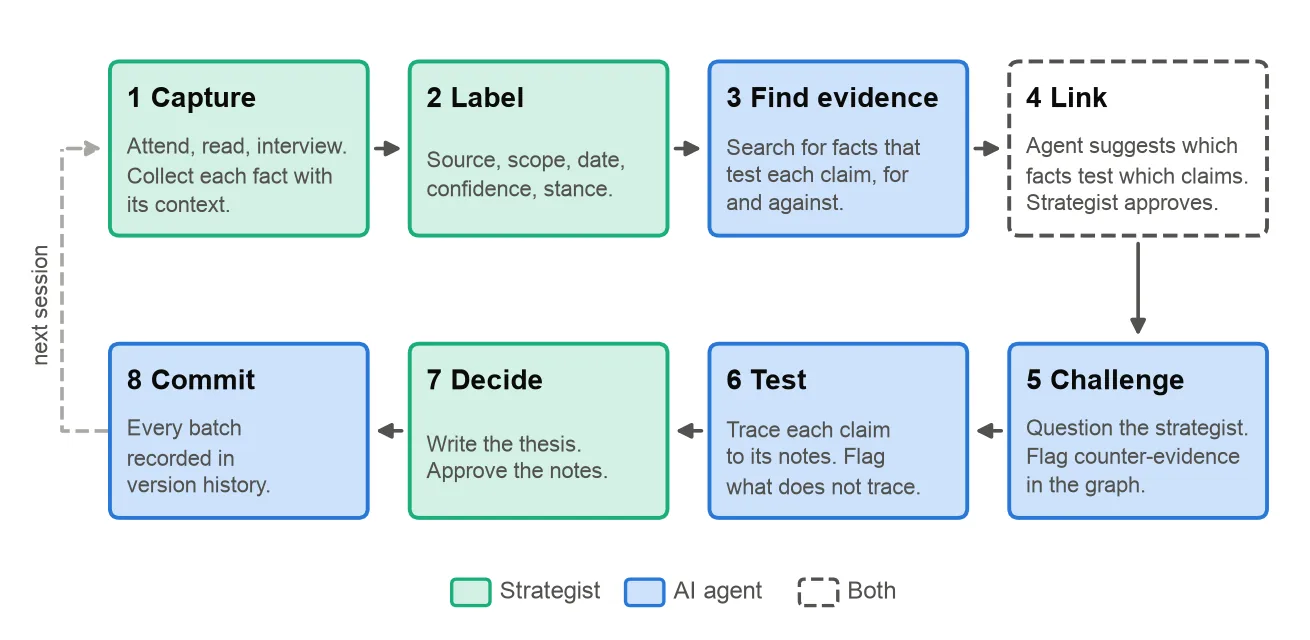
Figure A.5. The collection loop. Green steps belong to the strategist, blue to the agent, dashed to both. Every pass ends in a recorded commit, and the next session starts from the graph, not from zero.
Capture is where the work starts and where it cannot be delegated. The strategist attends the session, reads the material, runs the interview, and collects each fact with the context that gives it meaning. The agent’s part is to find and test: it searches for facts that bear on a claim, including facts that cut against it, and suggests which claim each fact tests. Nothing counts until the strategist has approved the link. Five rules keep the graph honest:
-
A fact earns a note only if it can support or challenge a specific claim.
-
One figure per note, so scopes and dates are never confused.
-
Derived figures show their arithmetic.
-
Unknowns stay unknown. Where a source withholds a number, its placeholder stays.
-
Internal and external facts never share a note.
Every property on a note exists to prevent one named error (Table A.3). If a property cannot name its error, it is dropped.
Table A.3. Note properties and the error each one prevents.
| Property | Error it prevents |
|---|---|
| Source and link | A claim nobody can check |
| As-of date | A stale figure presented as current |
| Scope | A group figure quoted as a unit figure |
| Confidence | A rough estimate treated as fact |
| Stance | One-sided evidence |
| Status | An unapproved note treated as settled |
A.5 How the agent traverses the graph
A language model does not hold the graph. It can only work with what sits in its context window, the material it can see at one time. In an agentic setup it fetches that material itself: it issues a tool call such as “open this file”, the harness runs it, and the model decides its next step (Yao et al., 2023). Three features make the graph navigable:
-
Links are pointers. A link is a note’s name in double brackets. One link is one hop.
-
Properties are a query language. Each note opens with labelled fields: source, date, scope, confidence and stance. The agent filters on them in one step.
-
Backlinks run the graph in reverse. Searching for a note’s name shows every note that points to it.
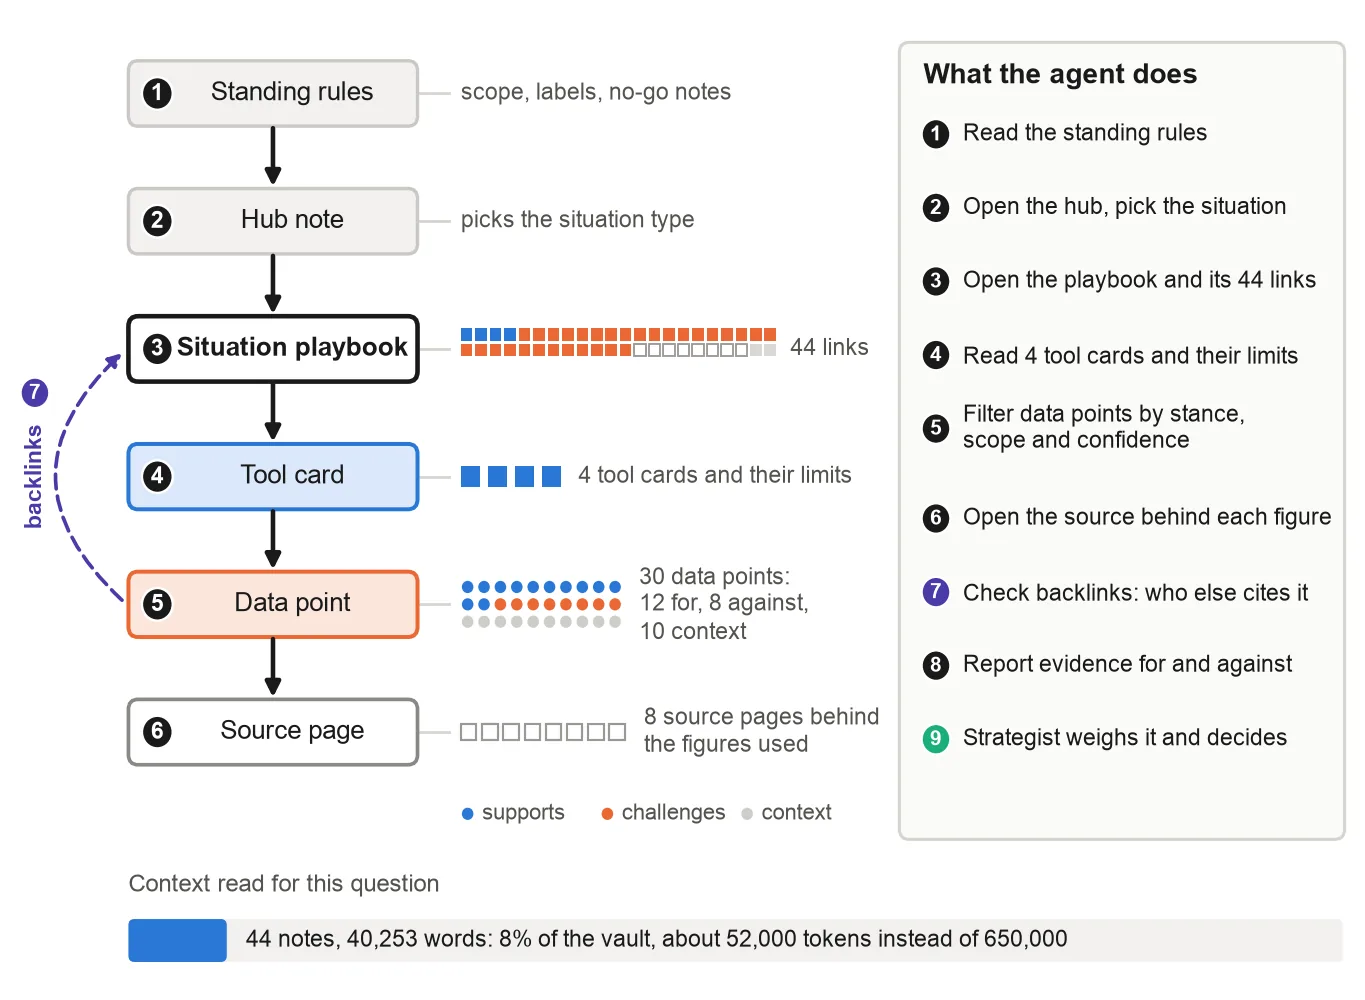
Figure A.6. One question traversed in the reference build, step by step.
The agent reads the standing rules first, so it knows the scope, the labels and the notes it must never touch. It opens the hub, identifies the situation and opens the matching playbook, which links to 44 notes: 4 tool cards, 30 data points, 8 source pages and 2 others. It reads the tool cards with their limits, filters the data points by stance, scope and confidence, opens the source of any figure it uses, and checks backlinks. Only then does it report back: the evidence for and against, each item naming its note, and any claim the graph does not support.
This differs from search in three ways. Each hop is an exact lookup, not a similarity score, so a fact that matters but resembles nothing in the question is not dropped. Reasoning is multi-hop by design, and agents that explore graphs this way stay traceable and correctable (Sun et al., 2024). And the context stays small: the playbook’s neighbourhood is 40,253 words, about 52,000 tokens, against about 650,000 for the whole vault. That is the just-in-time pattern Anthropic recommends to avoid context rot (Anthropic, 2025a).
A.6 Evaluation on the reference build
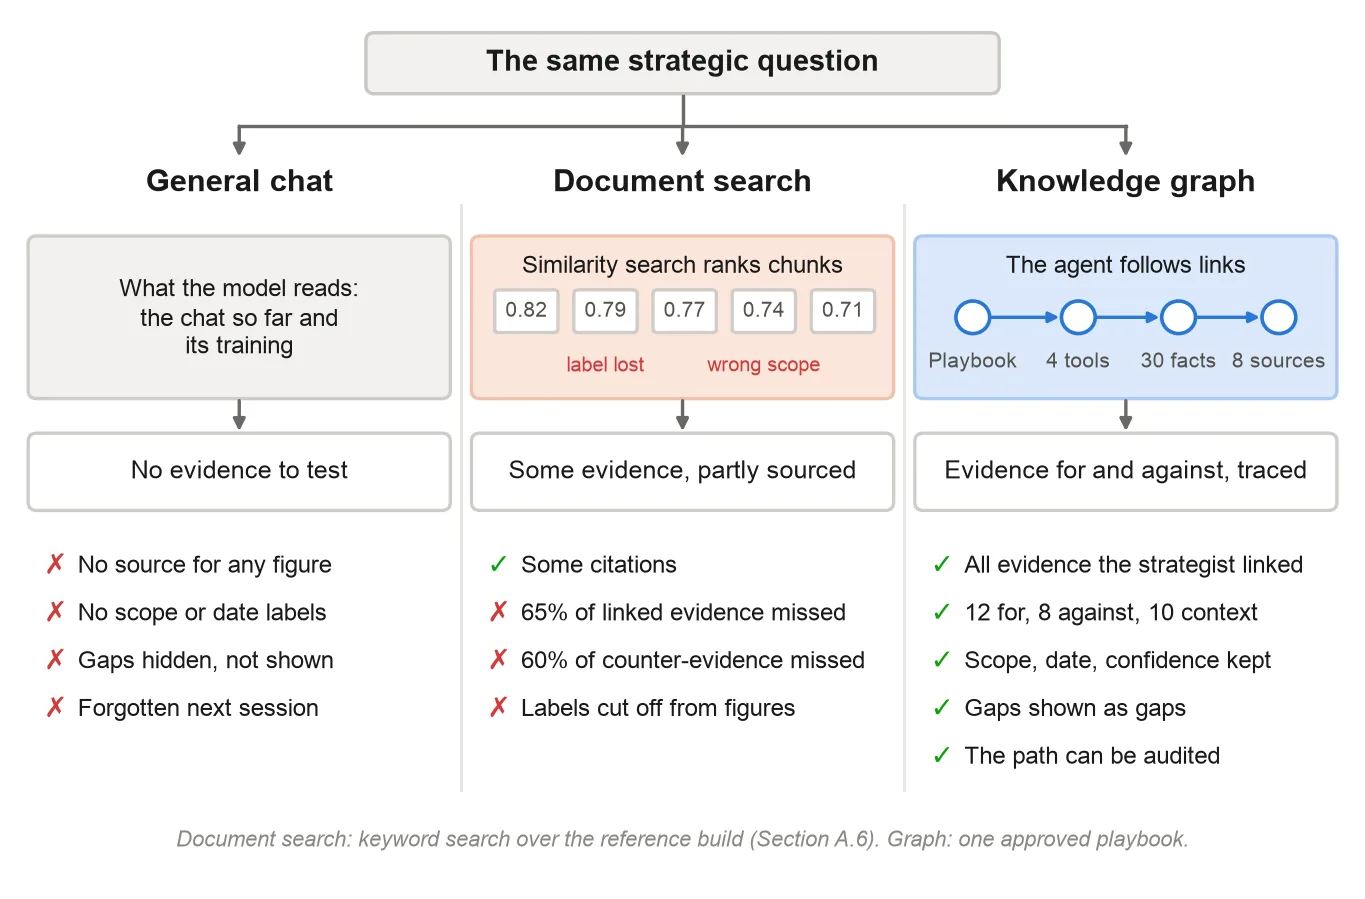
Figure A.7. The same question three ways. Only the graph puts the evidence for and against in front of the strategist with its labels intact.
For each of the 14 playbooks, its title and first 120 words became the question. A keyword search using BM25 (Robertson and Zaragoza, 2009) ranked all 151 data points and kept as many as the playbook links. Search ran over the same small, clean notes rather than raw documents, which helps it. Links and labels were removed, so the graph could not help it.
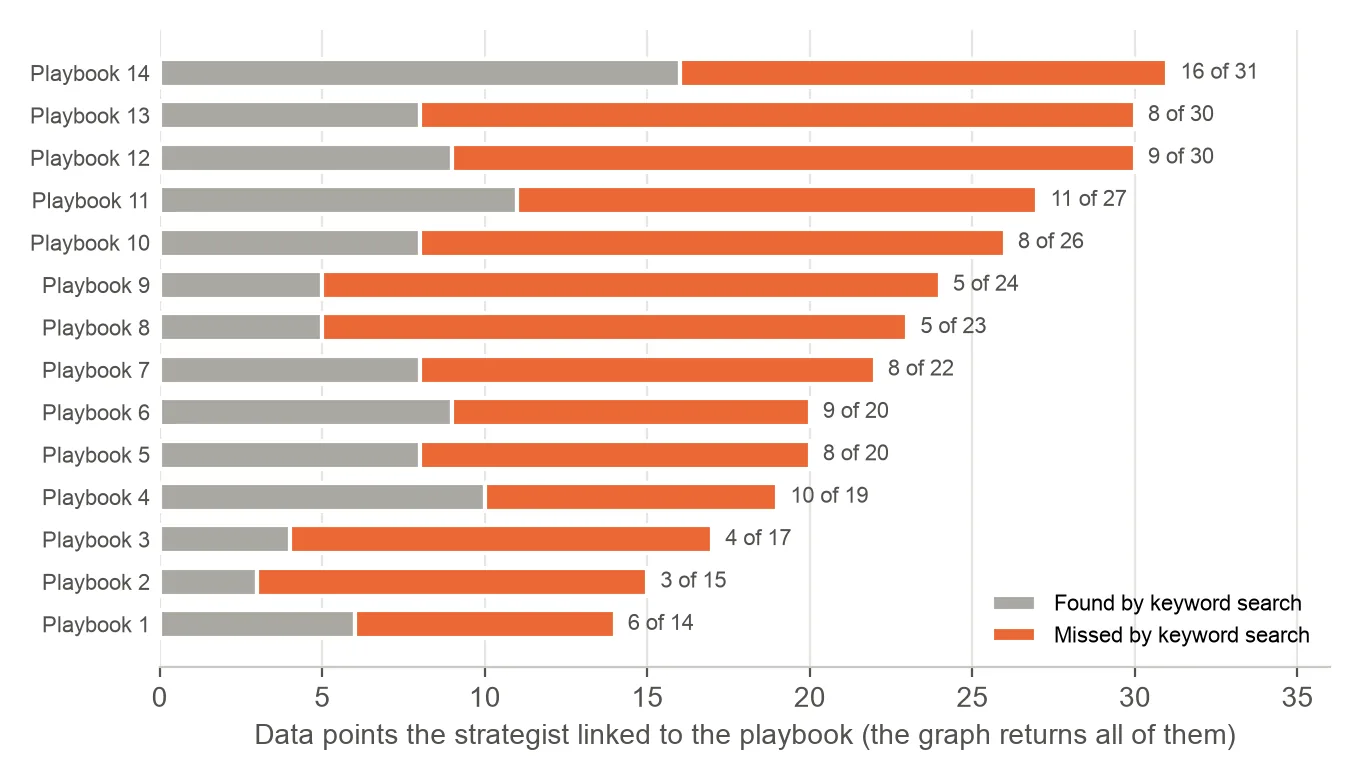
Figure A.8. Evidence the strategist linked to each playbook, split by whether keyword search found it. Search found 110 of 318 (35%). The graph returns all 318.
Keyword search found 110 of the 318 linked data points (35%) and 33 of the 82 that argue against the case (40%). Through their tool cards, playbooks also reach 4 to 15 more data points each at the second hop. Following links returns all of it, because the links are the strategist’s judgement of what is relevant. Search has to guess what the strategist already decided.
A.7 Grounded by design: close to zero unsupported claims
The core risk in AI-assisted analysis is a claim the evidence does not support (Ji et al., 2023). Research on how models work shows their default is to say they do not know, and errors appear when a sense of familiarity overrides that default (Anthropic, 2025e). The design keeps that default in place: what is not in the graph is treated as unknown. The same rule governs challenge: the agent may only challenge a conclusion with a note it can point to.
Table A.4. Errors, the control in the graph, and what can still go wrong.
| Error | Control in the graph | What can still go wrong |
|---|---|---|
| Invented figure | Every figure is a note with a source and link. Unknowns stay as placeholders | A source misread at capture |
| Wrong scope | Scope label on all 151 data points. A rule never to present a group figure as a unit figure | A label set wrong at capture |
| Stale fact | As-of date on every data point | The source itself is out of date |
| Unsupported conclusion | Each claim links to its data and tool notes. Approval by the strategist | Over-reach in the final paper |
| Ungrounded challenge | Every challenge must point to a data point, a tool card’s stated limit or a visible gap | A gap the graph cannot yet fill |
A check during the experiment found that all 151 data points carry a source, link, date and scope, all 110 tool cards record their assumptions and limits, and no note is orphaned. I say close to zero, not zero.
A.8 Human-centred design and the effort it takes
The design starts from one rule: the strategist stays at the helm. That rule shows up in four places.
-
The application. The question, the unit of analysis, the situation types and the tools that count are the strategist’s choices.
-
The data. All 151 data points were collected by the strategist with their context and links. 67 are first-hand: answers in interrogation sessions (49), an executive interview (12) and a partner meeting (6). The rest come from documents and research the strategist chose.
-
The links. The link scheme says what may link to what. The agent suggests which facts test which claims, and every link from a data point to a note was approved by the strategist before it counted.
-
The verdict. Only the strategist writes a thesis or sets a note to approved. 41 notes carry that formal status.
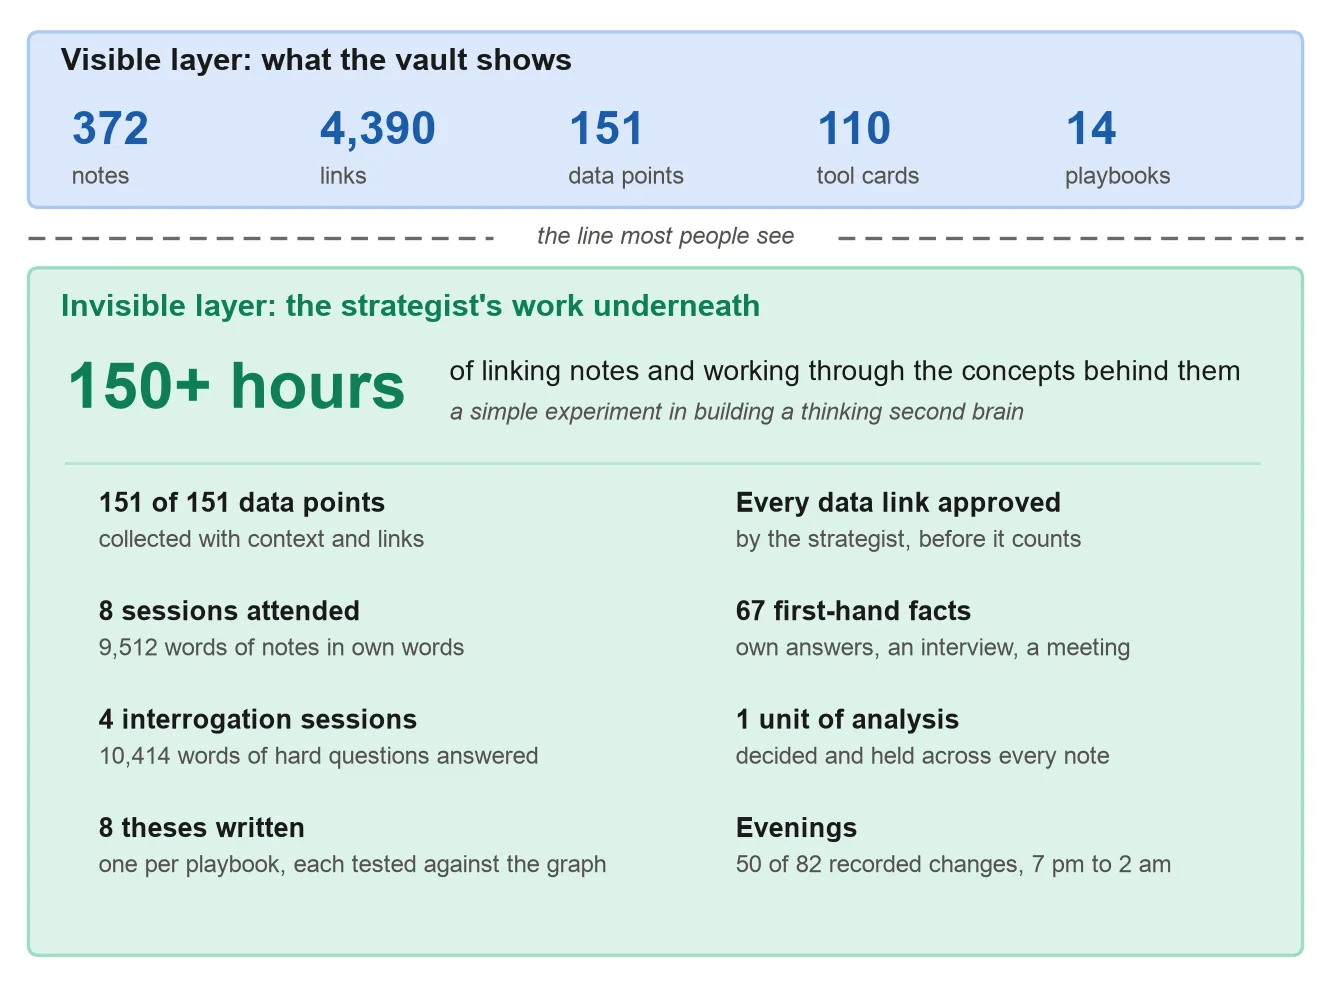
Figure A.9. Two layers of the same vault. The visible layer is what a reader sees. The invisible layer is the strategist’s work that makes it worth trusting.
To be honest, this is the part most people underestimate. More than 150 hours went into linking notes and working through the concepts behind them. That is the work that makes a link mean something: reading the tool, understanding where it misleads, and deciding which facts it should test. The agent is fast at finding evidence and asking hard questions. Judgement, access and accountability stay with the strategist. The research on cognitive effort explains why that matters: help that replaces thinking weakens it (Lee et al., 2025).
Table A.5. The strategist’s contribution to the reference build.
| Contribution | Measure |
|---|---|
| Linking and concept work | More than 150 hours |
| Data points collected with context and links | 151 of 151, every data link approved |
| Session notes in own words | 9,512 words across 8 sessions |
| Insight notes and decision records | 29 notes, 7,009 words |
| Interrogation sessions | 4 sessions, 10,414 words of questions and answers |
| Theses | 8, one per playbook |
| Working rhythm | 50 of 82 recorded changes between 7 pm and 2 am |
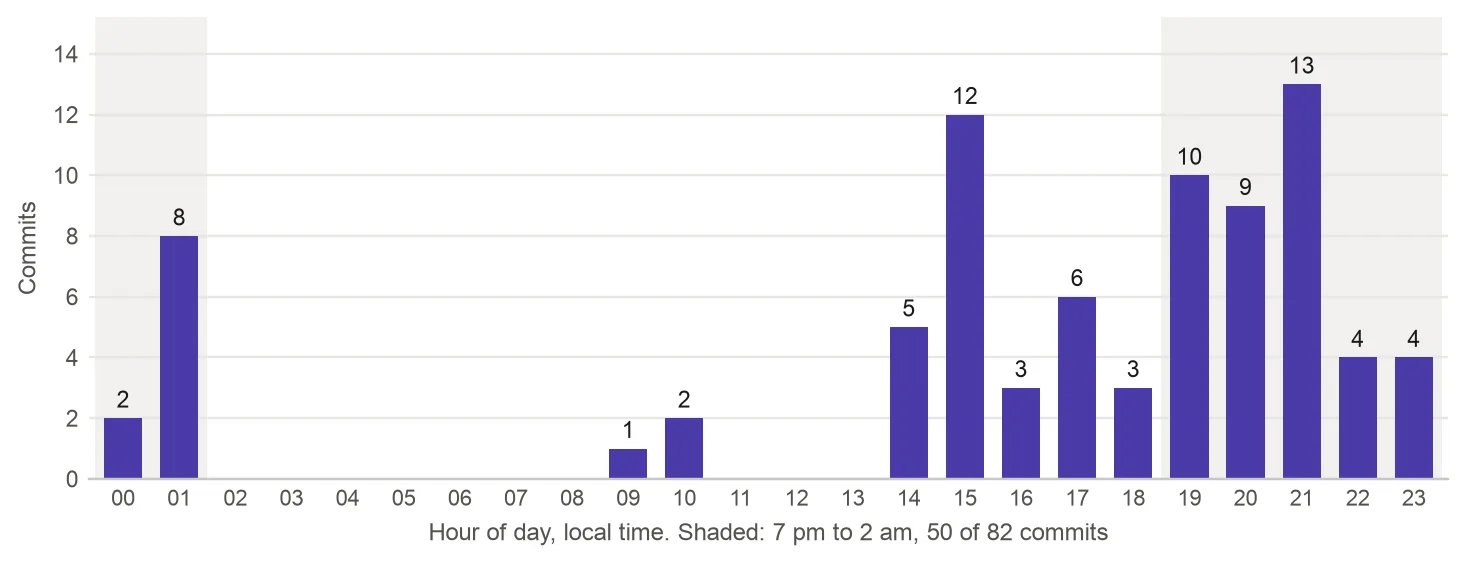
Figure A.10. When the work happened, 4 to 7 October 2026.
A.9 From graph to strategy: the final formulation
The graph does not formulate the strategy. It narrows the field so the strategist can. Figure A.11 follows one approved playbook.
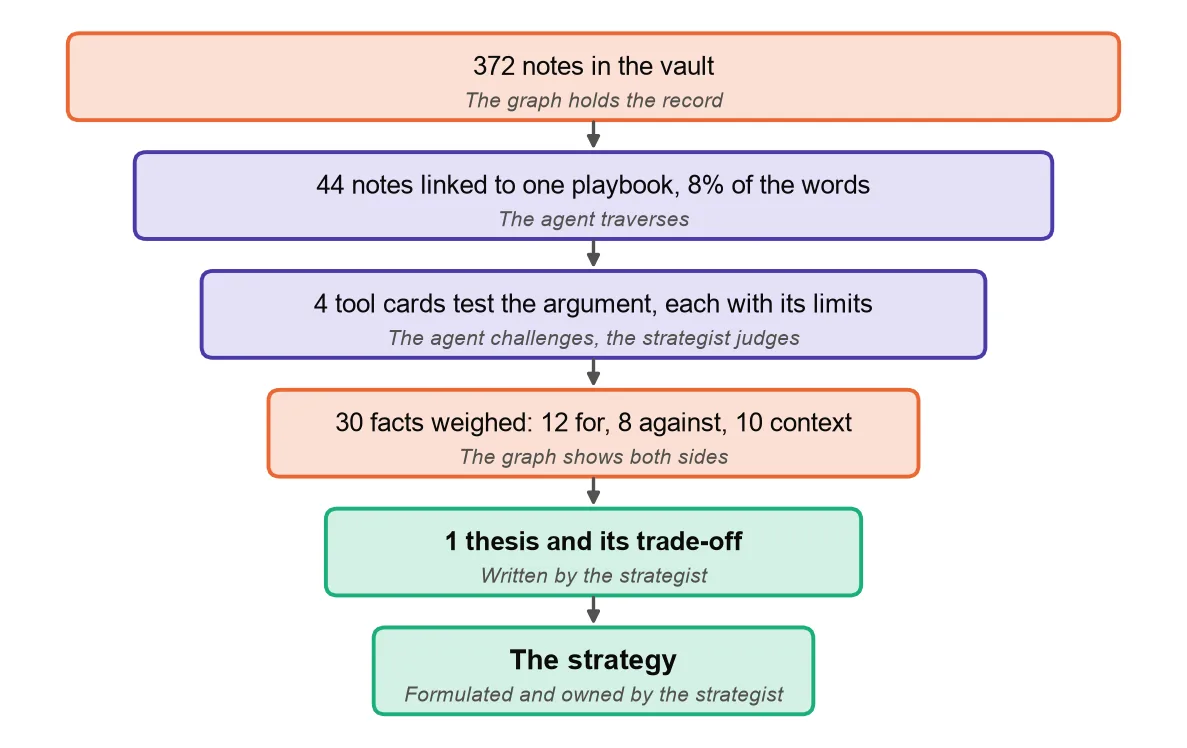
Figure A.11. From 372 notes to one strategy. Orange steps are held by the graph, violet by the agent, green by the strategist.
-
Frame. The strategist states the question and picks the situation type, which decides the playbook and the tools.
-
Gather. The agent retrieves the playbook’s 44 linked notes, the evidence for and against.
-
Test. Four tool cards test the argument, each with its assumptions and limits in view.
-
Weigh. Thirty facts sit side by side: 12 for, 8 against, 10 context. Across the vault, the labels also showed the strategist’s own sources leaning to support (29 for, 11 against) and public research leaning against (19 for, 23 against). That gap between the inside and outside view (Kahneman and Lovallo, 1993) became a question to answer.
-
Challenge. The agent challenges the strategist’s thesis with the counter-evidence in the graph, one question at a time.
-
Decide. The strategist writes the thesis and its trade-off, and approves the playbook.
-
Check. The agent traces every claim back to a note. The strategist fixes what does not trace.
The thinking is the strategist’s at every step. The graph changes how much evidence that thinking works with, how fast, and how visibly.
A.10 Moving up the strategist tiers
Not every strategist starts in the same place. Figure A.12 sets out six tiers, from very bad to exceptional, with the typical gap at each tier and what the second brain adds to close it. The tiers are a working heuristic from this experiment, not a validated scale.
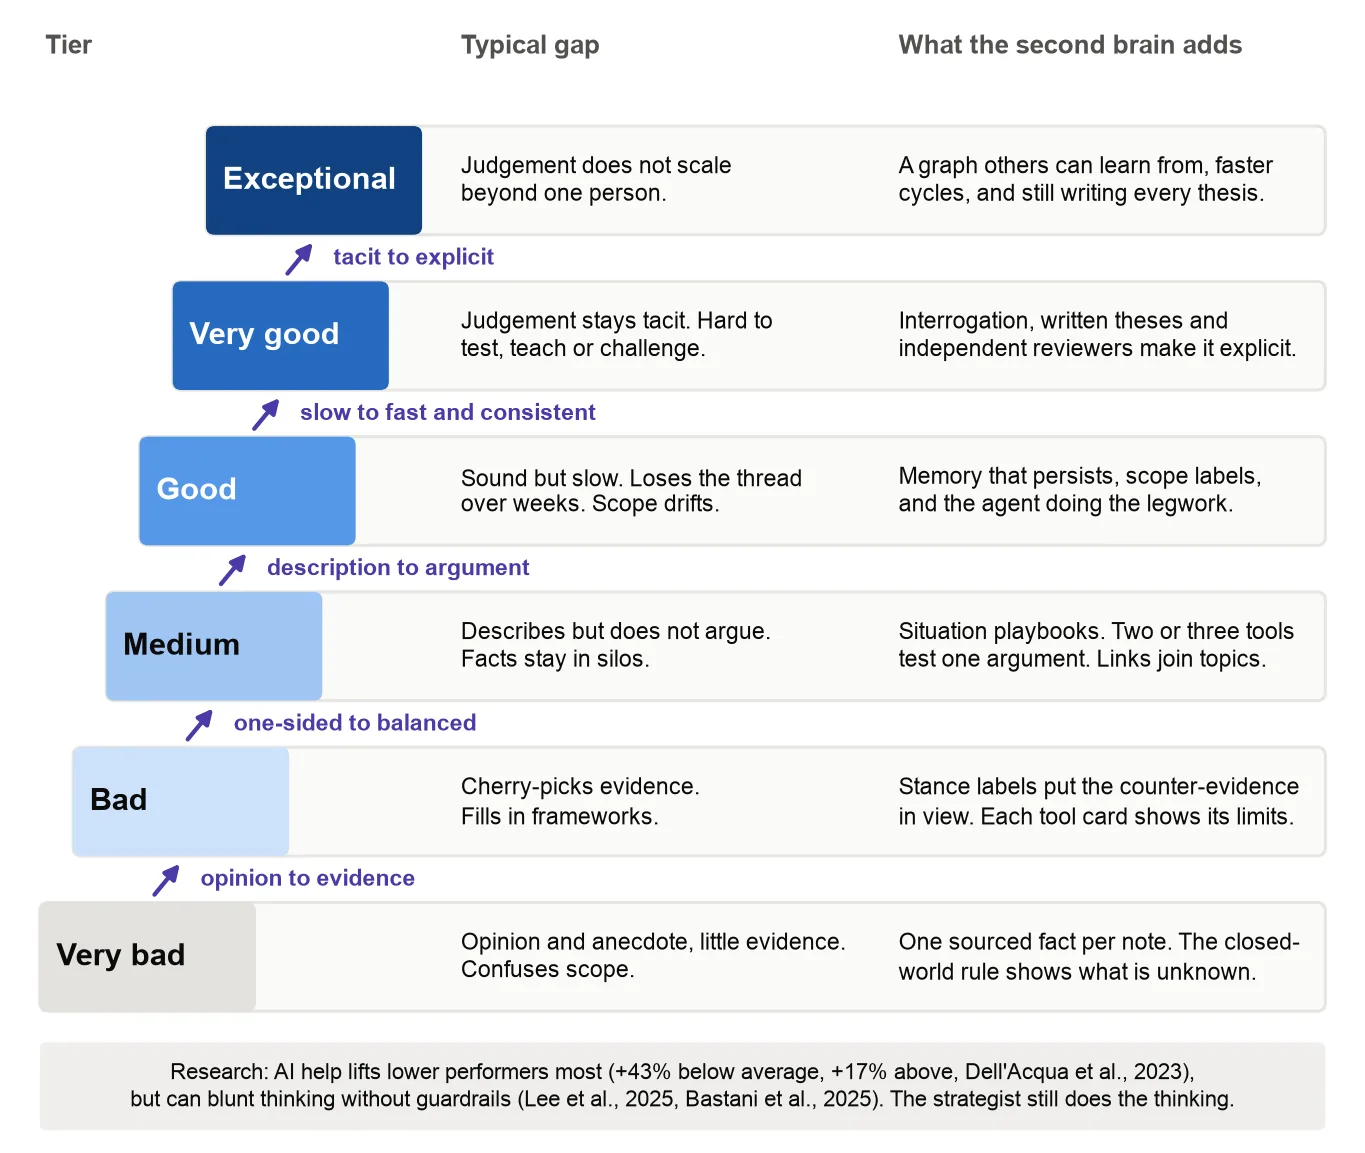
Figure A.12. Six strategist tiers. Each move up closes one gap. The method removes friction, not thinking.
The research suggests where the gains are largest. AI help lifted below-average consultants by 43% against 17% for the above-average (Dell’Acqua et al., 2023), and novice support agents by 34% (Brynjolfsson et al., 2025). It also carries a warning. Students who leaned on GPT-4 without guardrails did worse once it was removed, while a guarded tutor avoided the harm (Bastani et al., 2025). The second brain is built as the guarded version: the agent questions and finds evidence, but the strategist writes every thesis and approves every link.
Lower tiers: from opinion to balance. Sourced facts and visible unknowns move a very bad strategist from anecdote to evidence. Stance labels and linked counter-evidence stop a bad strategist picking only the parts that agree.
Middle tiers: from description to argument. Playbooks and links make a medium strategist test one argument with two or three tools across topics. Persistent memory, scope labels and the agent’s evidence finding make a good strategist fast and consistent.
Upper tiers: from tacit to multiplied. Interrogation and written theses make a very good strategist’s tacit judgement explicit and open to challenge, a check on the overconfidence Lee et al. (2025) describe. For an exceptional strategist, the graph becomes a record others can learn from, and writing every thesis keeps their own thinking sharp.
Each move takes the strategist’s effort. A tier is earned in the thinking, not granted by the tool.
A.11 Industry applications of knowledge graphs
Knowledge graphs are well established in industry. Figure A.13 shows nine deployments across nine sectors, from search and retail to drug discovery, engineering, journalism and healthcare.
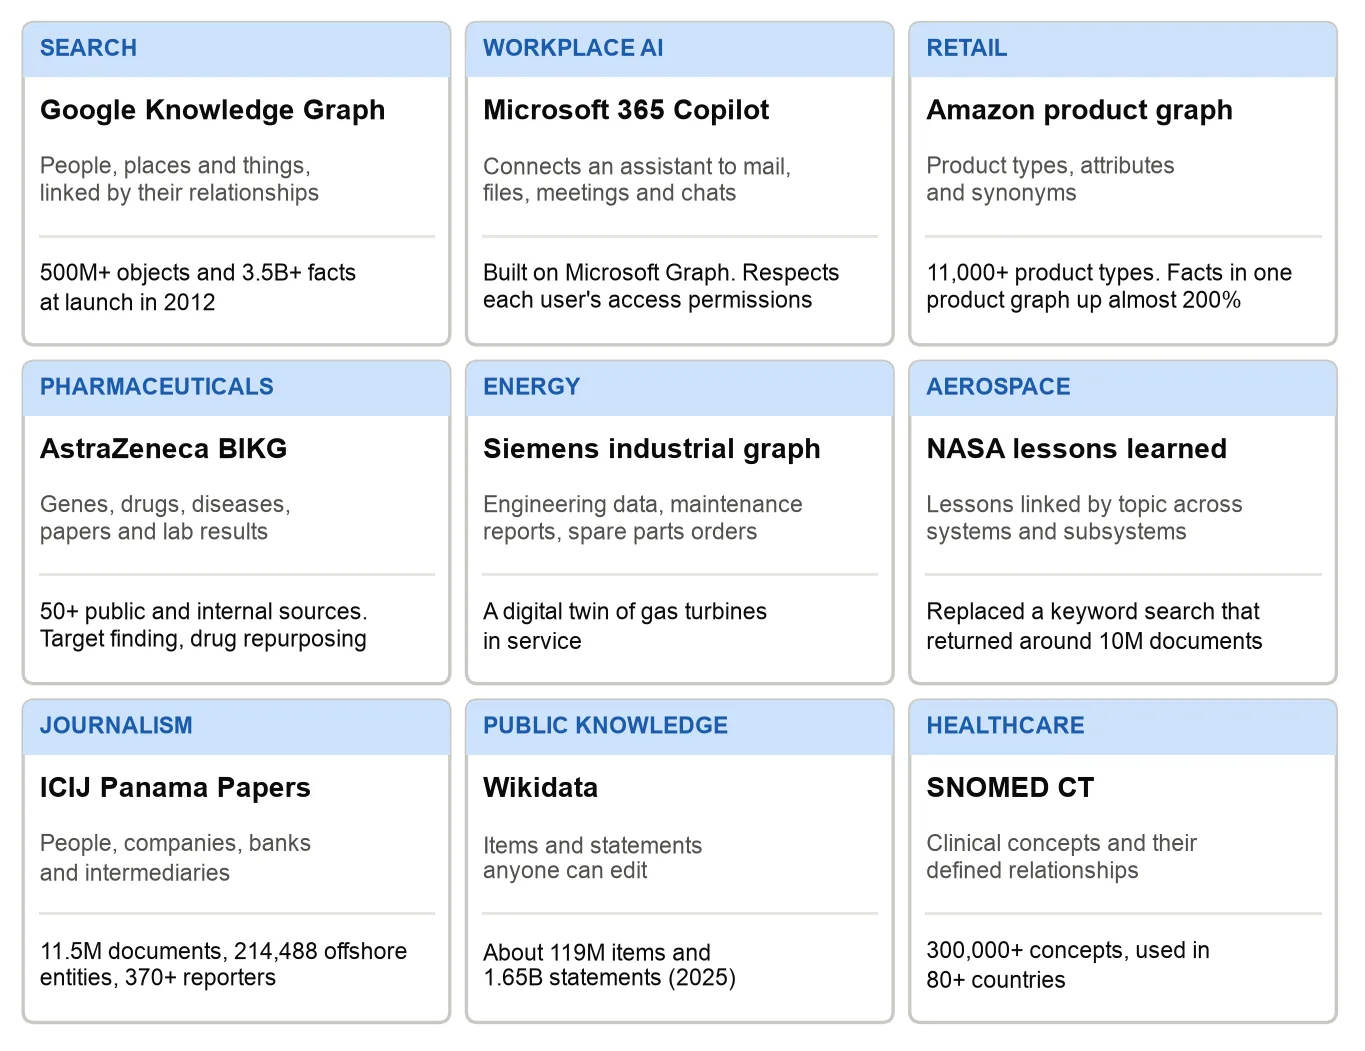
Figure A.13. Knowledge graphs in nine industries. Sources are listed in the references.
These graphs differ from the second brain in scale. Most are built and maintained by machines, with people curating the edges. The second brain is small and built by one strategist, so its value is judgement rather than coverage. Microsoft 365 Copilot shows the two can meet (Microsoft, 2025).
The same method applies wherever a question runs for weeks, the facts are many and a person must stand behind the conclusion: due diligence, enterprise account planning, ERP solution design, product strategy, board papers and research reviews.
A.12 Plain graph, knowledge graph and knowledge graph with inference
Three kinds of graph are easy to confuse (Figure A.14, Table A.6). A plain graph records that two notes are connected, not how. A knowledge graph adds meaning: each note has a type and properties, and each connection says what kind of relationship it is (Hogan et al., 2021). A knowledge graph with inference derives new relationships from the ones already there. If a fact challenges a tool that tests the playbook’s argument, the fact bears on the thesis even though nobody linked the two.
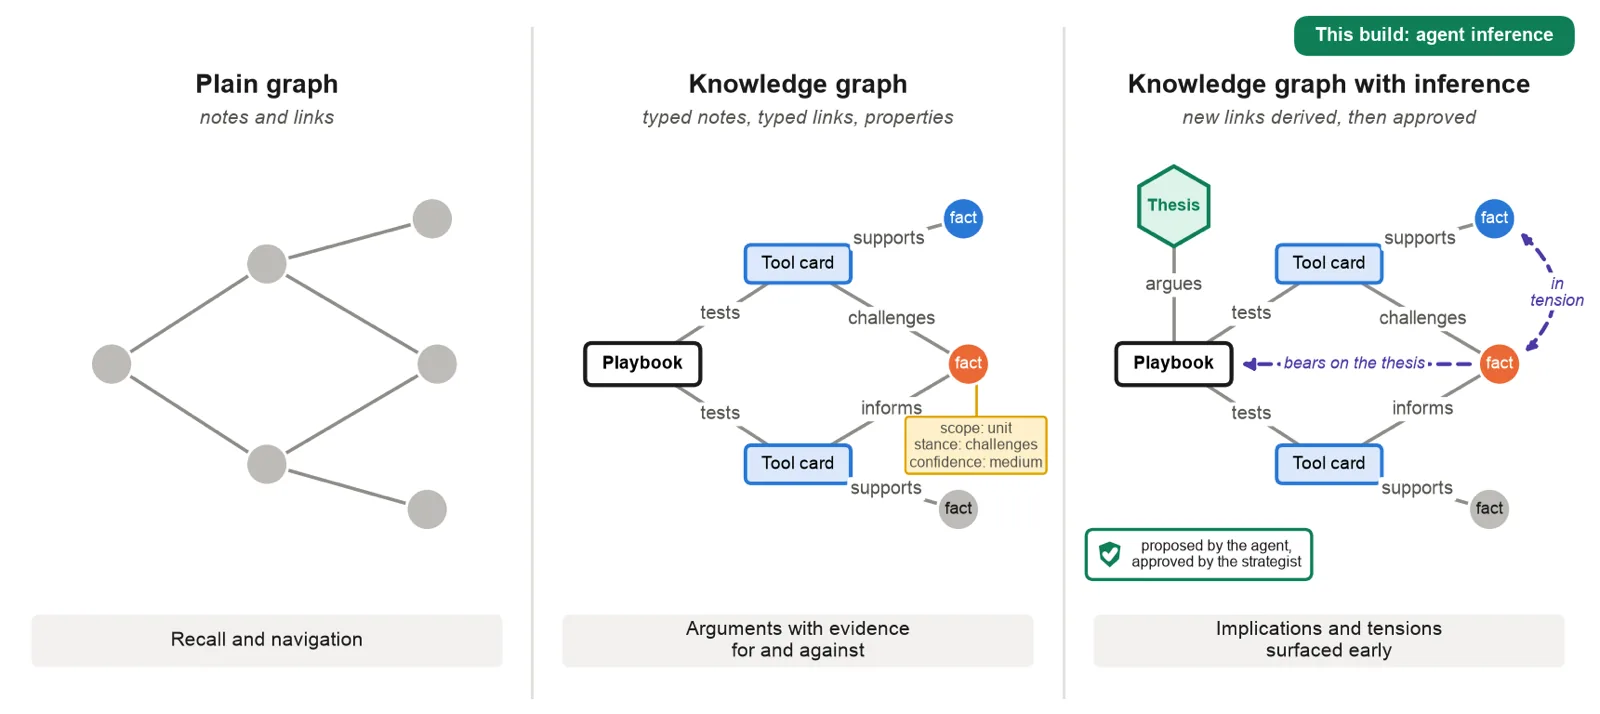
Figure A.14. The same notes as a plain graph, a knowledge graph and a knowledge graph with inference. Dashed violet links are inferred, here by the agent and approved by the strategist.
Table A.6. What each kind of graph stores, gives strategy, and risks.
| Plain graph | Knowledge graph | With inference | |
|---|---|---|---|
| Stores | Notes and links | Typed notes, typed relationships, properties | All of that, plus relationships derived by rules or an agent |
| For strategy | Recall and navigation | Arguments with evidence for and against | Implications and tensions surfaced early |
| Main risk | Links without meaning | Effort to keep types and labels right | Plausible but wrong inferences, hence approval |
The reference build is a knowledge graph with agent inference, with two qualifications. Its notes are typed and labelled but its links are not, so a relationship is carried by the properties at either end, such as a stance of “challenges”. And the agent infers when a question is asked, rather than a formal rules engine, so every inferred link is a proposal until the strategist approves it. The inside and outside view gap in A.9 is one such inference.
For strategy, the step to a knowledge graph is the step from recall to argument. The step to inference is the step from argument to foresight, where implications and tensions surface early. It is also where errors start to sound plausible, which is why every inference needs an owner.
I should be humble about scale. Inference across an enterprise graph is very hard: teams must agree on types and terms, the same customer must be recognised across systems, access rights must follow the data, and the graph must keep pace with the business. A short, sharp strategic engagement is different: one question, a few weeks, a few hundred notes and one accountable strategist. At that size the method is manageable.
A.13 Practical foundations, and why they are barriers today
Behind the method sit a handful of generic foundations. None belongs to one product and none is hard on its own, but each has to be thought through for the system to work. Table A.7 lists them and Figure A.15 shows the agent design.
Table A.7. Practical foundations, what each is for, and why it is a barrier today.
| Foundation | What it is for | Why it is a barrier today |
|---|---|---|
| Plain-text notes (Markdown) | Any tool and any model can read them, and the strategist owns them | Most knowledge sits in documents, decks and email |
| A graph viewer (Obsidian in the reference build) | Makes links, backlinks and properties visible to the strategist | A new tool and a new habit |
| Speaking the model’s language | Short notes, one idea each, consistent terms and explicit labels a model can use | Few people know how a model reads |
| A tidy folder structure | Predictable homes for sources, evidence, tools, playbooks and the strategist’s own notes | Needs discipline from the first day |
| Content files | Long sources turned into plain text the model can read whole, such as one file per page | Converting PDFs and slides takes effort |
| Properties in YAML | A short block of labelled fields at the top of each note, for the agent to filter on | Unfamiliar syntax, easy to get wrong |
| Version control (Git) | Every change recorded, so any claim can be traced and any mistake undone | Seen as a tool for software developers |
| Agents and sub-agents | A lead agent that plans and traverses, and focused sub-agents that question, find evidence, check and review | Needs design, rules and trust |
Today these foundations are real barriers, which is why work like this is still rare. They are not permanent. As AI literacy grows, plain-text knowledge, version history and agents will become as ordinary as spreadsheets and shared drives. I hope this appendix turns out to describe the future rather than an experiment.
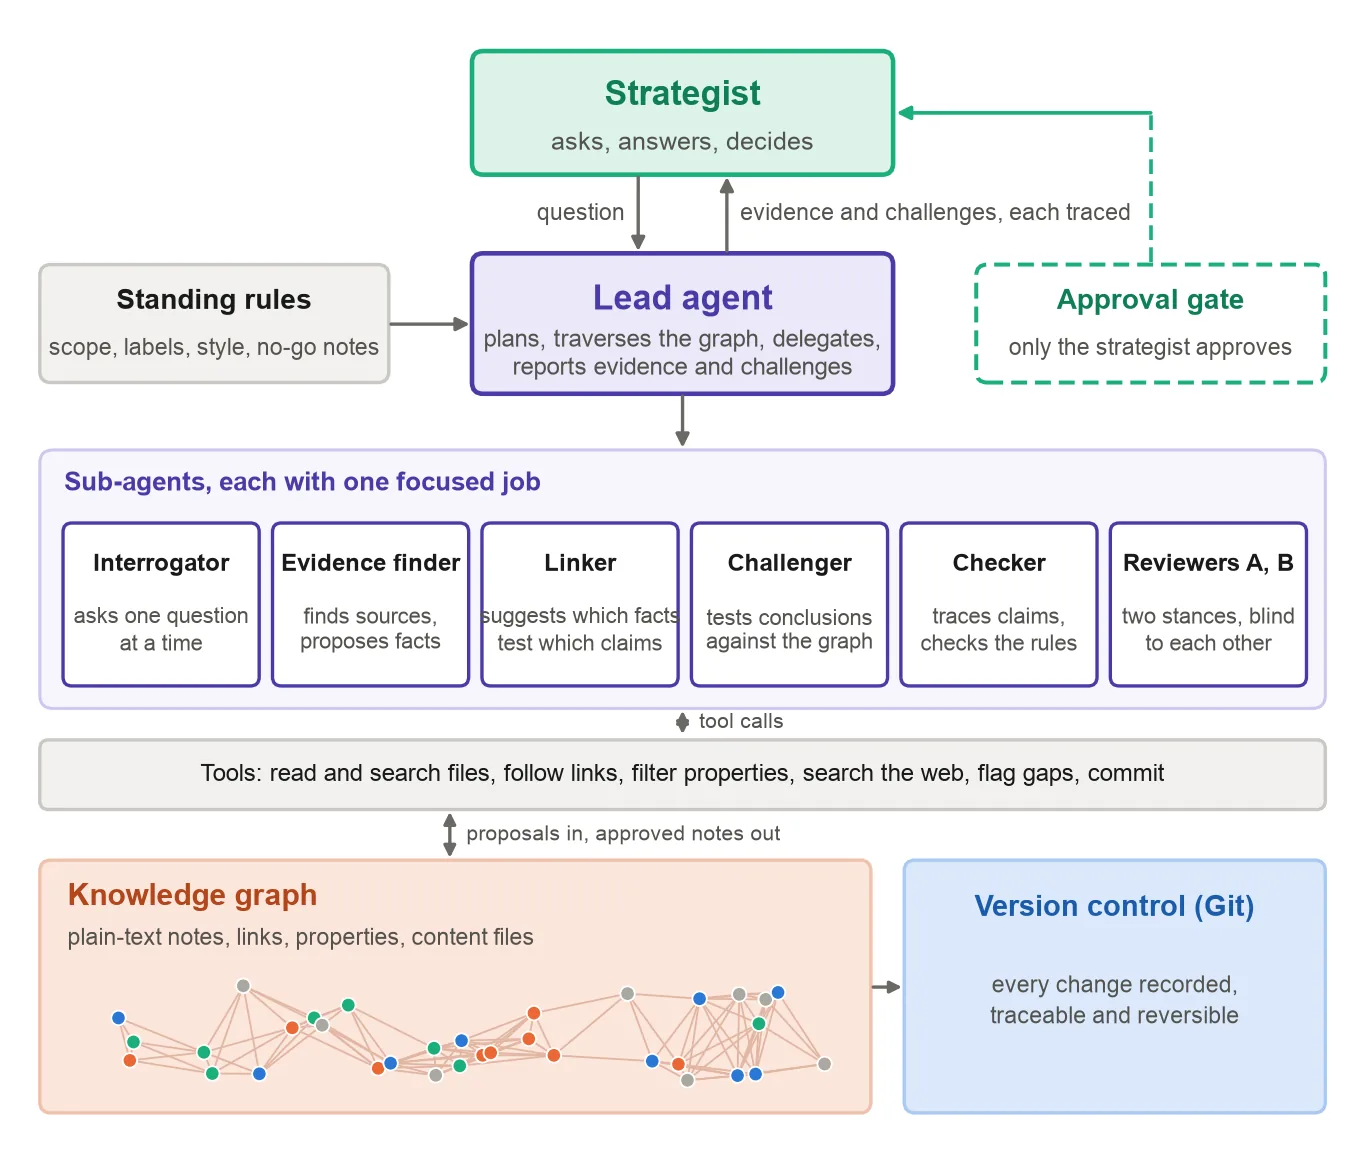
Figure A.15. A generic agent design for the second brain. A lead agent works under standing rules and delegates focused jobs to sub-agents. Everything they find or flag is a proposal until the strategist approves it.
A.14 Limitations and future work
Four limits apply. First, keyword search is a simple baseline, and search by meaning would do better on paraphrase. Second, the test measures how much of the strategist’s chosen evidence search surfaces, not whether those choices were right. Third, the published graph studies use machine-built graphs, and the difference a strategist-built graph makes has not been benchmarked beyond the test in A.6. Fourth, the graph needs upkeep: figures age, and internal material needs the right data handling. A claim trace audit, which checks every claim in a strategy paper against the graph, is the next measure to run.
A.15 Conclusion
A language model on its own is a well-read generalist with no memory of your business. Document search gives it some of your text but not the connections between the facts. A knowledge graph built and owned by the strategist gives it the connections, and an agent that walks them gives the strategist speed without giving up control. On the reference build, keyword search found 35% of the evidence linked to each argument and 40% of the counter-evidence, while traversal found all of it. The agent challenges and tests, always from the graph, and the conclusions stay with the strategist. The cost is the strategist’s time, more than 150 hours in this experiment, and that cost is also why the result can be trusted. The method is very hard across an enterprise today, but manageable for a short, sharp strategic engagement.
I will build on the experiment in five steps:
-
Start every strategic question from the same structure: sources, data points, tool cards, playbooks and my own theses.
-
Keep the AI partner to two jobs: challenge conclusions already reached, and find evidence that tests claims.
-
Type the links, such as supports, challenges and tests, so the graph carries meaning as well as connection.
-
Run a claim trace audit on every strategy paper before it goes out.
-
Carry tool cards and evidence across engagements, so each question starts ahead of the last.
My ask of the reader: pick one live strategic question. Give it a graph, a short set of rules and two hours a week of your own thinking. After a month, put the same question to a plain chat, to document search and to the graph, and compare what you can trace.
References
Anthropic (2024). Introducing Contextual Retrieval. Anthropic, 19 September 2024.
Anthropic (2025a). Effective context engineering for AI agents. Anthropic Engineering, 29 September 2025.
Anthropic (2025b). Managing context on the Claude Developer Platform. Anthropic, 29 September 2025.
Anthropic (2025c). How we built our multi-agent research system. Anthropic Engineering, 13 June 2025.
Anthropic (2025d). Introducing Citations on the Anthropic API. Anthropic, 2025.
Anthropic (2025e). Tracing the thoughts of a large language model. Anthropic Research, 27 March 2025.
Bastani, H., Bastani, O., Sungu, A., Ge, H., Kabakcı, Ö. and Mariman, R. (2025). Generative AI without guardrails can harm learning: Evidence from high school mathematics. Proceedings of the National Academy of Sciences, 122.
Brynjolfsson, E., Li, D. and Raymond, L. (2025). Generative AI at Work. Quarterly Journal of Economics, 140(2).
Bush, V. (1945). As We May Think. The Atlantic Monthly, July 1945.
Dell’Acqua, F., McFowland, E., Mollick, E., et al. (2023). Navigating the Jagged Technological Frontier: Field Experimental Evidence of the Effects of AI on Knowledge Worker Productivity and Quality. Harvard Business School Working Paper 24-013.
Dong, X. L., He, X., Kan, A., et al. (2020). AutoKnow: Self-Driving Knowledge Collection for Products of Thousands of Types. KDD 2020.
Edge, D., Trinh, H., Cheng, N., et al. (2024). From Local to Global: A Graph RAG Approach to Query-Focused Summarization. Microsoft Research. arXiv:2404.16130.
Forte, T. (2022). Building a Second Brain. Atria Books.
Geleta, D., Nikolov, A., Edwards, G., et al. (2021). Biological Insights Knowledge Graph: an integrated knowledge graph to support drug development. bioRxiv 2021.10.28.466262.
Gutiérrez, B. J., Shu, Y., Gu, Y., Yasunaga, M. and Su, Y. (2024). HippoRAG: Neurobiologically Inspired Long-Term Memory for Large Language Models. NeurIPS 2024. arXiv:2405.14831.
Han, H., Ma, L., Wang, Y., et al. (2025). RAG vs. GraphRAG: A Systematic Evaluation and Key Insights. arXiv:2502.11371.
Ji, Z., Lee, N., Frieske, R., et al. (2023). Survey of Hallucination in Natural Language Generation. ACM Computing Surveys, 55(12).
Hogan, A., Blomqvist, E., Cochez, M., et al. (2021). Knowledge Graphs. ACM Computing Surveys, 54(4).
Kahneman, D. and Lovallo, D. (1993). Timid Choices and Bold Forecasts: A Cognitive Perspective on Risk Taking. Management Science, 39(1).
Laban, P., Hayashi, H., Zhou, Y. and Neville, J. (2025). LLMs Get Lost In Multi-Turn Conversation. Microsoft Research and Salesforce Research. arXiv:2505.06120.
Lee, H.-P., Sarkar, A., Tankelevitch, L., et al. (2025). The Impact of Generative AI on Critical Thinking: Self-Reported Reductions in Cognitive Effort and Confidence Effects From a Survey of Knowledge Workers. CHI 2025. Carnegie Mellon University and Microsoft Research.
Lewis, P., Perez, E., Piktus, A., et al. (2020). Retrieval-Augmented Generation for Knowledge-Intensive NLP Tasks. Advances in Neural Information Processing Systems 33.
Luhmann, N. (1981). Kommunikation mit Zettelkästen. In H. Baier et al. (eds), Öffentliche Meinung und sozialer Wandel. Westdeutscher Verlag.
metaphacts (n.d.). Industrial Knowledge Graph at Siemens. Case study.
Microsoft (2025). Microsoft 365 Copilot overview, and Semantic index for Copilot. Microsoft Learn.
Neo4j (2016). How Neo4j was used to analyze the Panama Papers dataset: interview with Mar Cabra of the ICIJ. Neo4j.
Neo4j (n.d.). How NASA finds critical data through a knowledge graph. Neo4j blog.
Robertson, S. and Zaragoza, H. (2009). The Probabilistic Relevance Framework: BM25 and Beyond. Foundations and Trends in Information Retrieval, 3(4).
Singhal, A. (2012). Introducing the Knowledge Graph: things, not strings. Google, 16 May 2012.
SNOMED International (n.d.). What is SNOMED CT? SNOMED International.
Sun, J., Xu, C., Tang, L., et al. (2024). Think-on-Graph: Deep and Responsible Reasoning of Large Language Model on Knowledge Graph. ICLR 2024. arXiv:2307.07697.
Wikidata (2025). Wikidata:Statistics. Wikimedia Foundation.
Yao, S., Zhao, J., Yu, D., et al. (2023). ReAct: Synergizing Reasoning and Acting in Language Models. ICLR 2023. arXiv:2210.03629.
Comments
(Comment with your GitHub account. I read every one and reply. Be kind and specific.)